Written by Elma Steven | Updated on February, 2024

How to Write a Dog Cafe Business Plan?
Dog Cafe Business Plan is an outline of your overall Dog Cafe business. The business plan includes a 5 year projection, marketing plan, industry analysis, organizational overview, operational overview and finally the executive summary. Remember to write your executive summary at the end as it is considered as a snapshot of the overall business plan. The creation of a dog cafe business plan requires careful consideration of various factors that might impact the business’s success. Ultimately, a dog cafe business plan serves as a roadmap to guide the company’s direction.
Executive Summary
Furry Latte Lounge offers a unique café for dog lovers and coffee enthusiasts. It was founded by Henry Thomas and is located in Miami. In addition to serving high-end coffee we also provides doggy snacks and a comfortable place to hang out. The Miami café scene is being revolutionized by Furry Latte Lounge and our management has extensive expertise in both the hospitality industry and pet care. Our USPs include 24/7 access to Wi-Fi and a great ambience. In addition, our location enjoys a ton of foot traffic and there is lack of competition within close proximity.
Mission: Our mission is to provide a one-of-a-kind environment where dog owners and their four-legged friends can relax over a cup of coffee and make new friends. In addition, we want to foster community and friendship by offering high-quality coffee, excellent service and a welcoming space for dogs.
Vision: Our vision is to revolutionize the café culture by fusing two of life’s greatest pleasures; a good cup of coffee and the company of a dog. We want to be recognized as a must-visit destination. A place where locals and visitors alike can bring their dogs to socialize, unwind and make lifelong memories together.
Industry Overview: Dog cafe industry is growing at a CAGR of 12% during the period of 2018 to 2023. The industry is mostly getting popular for growing adoption and liking towards pets. It has been found in survey that people usually love to hangout with pets but do not want to take responsibilities. The US Dog cafe industry is valued at $3.7 billion in 2023.
Financial Overview:
In this section summarize KPIs such as a revenue, profit and cost in one graph or chart. This will help readers more interested to read the whole business plan.
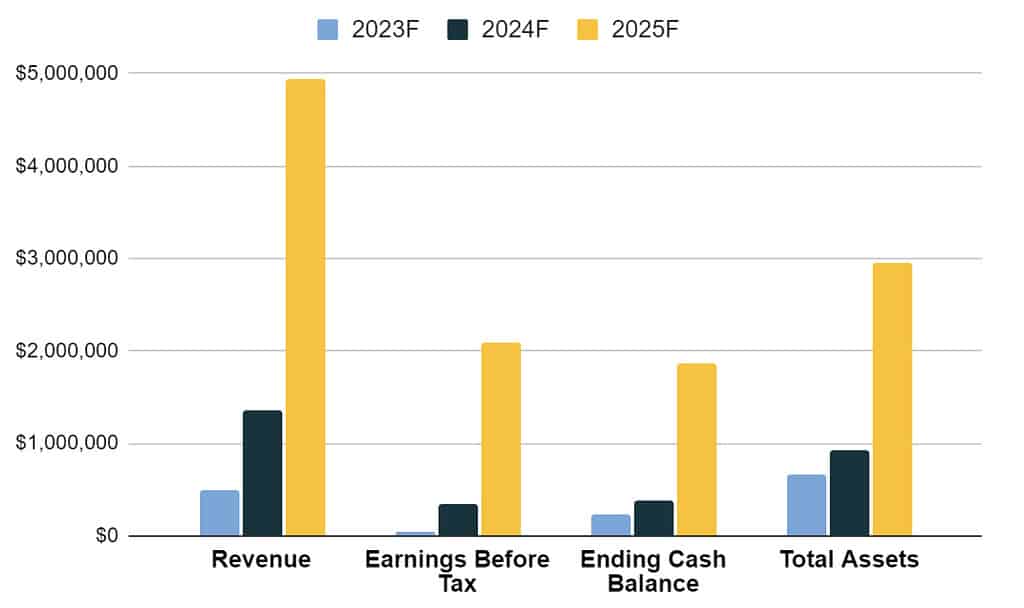
In total there are 21 tabs in the financial model. You can use this with Google Sheets or Microsoft Excel.
Ask/ Funding Request
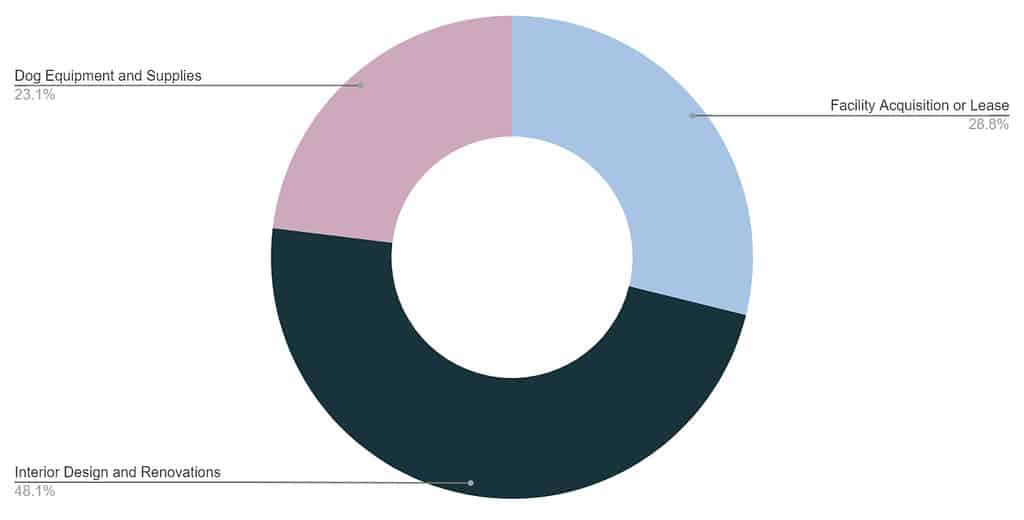
This is a very important part of your business plan. Make a list of items that you need to invest on for either starting the business or for expansion.
Business Description
Business Name:
Founders:
Management Team:

Legal Structure: [e.g. LLC]
Location:
Goals:
Services:
Business Model Canvas
The Business Model Canvas is a high-level overview of the business model. It can also be considered as the business model map in the overall dog cafe business plan. The important partners, key activities, value proposition and cost & revenue sections are only some of the nine vital components. A company idea’s complexities may be mapped out, analyzed and communicated with the use of the canvas. It shows the whole picture of a company’s value creation, delivery, and capture processes. It helps new business owners hone their ideas, encourage creative thinking and make sound strategic decisions. It’s a helpful resource for coming up with ideas, organizing plans and presenting business models to key players.

SWOT
A SWOT analysis is integral to the dog cafe business plan. It offers a clear lens into a company’s strengths, weaknesses, opportunities, and threats. This self-awareness enables effective resource allocation and strategic positioning against competitors. Businesses can mitigate risks, make informed decisions, and set realistic goals. In addition, presenting a SWOT analysis in a business plan communicates to stakeholders that the company possesses a deep understanding of its market environment. In essence, SWOT ensures a business’s strategy is grounded in reality enhancing its chances of success.

Industry Analysis
Problems and Opportunities
- Regulations: regulations and permits may be required for operating a dog cafe.This can add to the cost of starting and operating the business.
- Liability: there is always the ris………..
Target Market Segmentation
- Geographic Segmentation:
- Demographic Segmentation:
- Psychographic Segmentation:
- Behavioral Segmentation:
Market Size
Marketing Plan
A marketing plan of a dog cafe business plan outlines the company’s strategy to promote its products or services to its target audience. It includes specific tactics and channels the business will use to reach potential customers. This section defines the company’s unique value proposition, identifies the target market segments, and discusses the competitive landscape. It also includes insight into budget allocation, projected outcomes and key performance indicators to measure success. Marketing plan helps businesses demonstrate their understanding of the market dynamics, their positioning within the industry and their approach to driving customer engagement and sales.

Dog Events: To attract customers’ attention, we create events for dogs and encourage dog owners to join.
Online Advertisement: Following the trend of surfing the Internet every second of customers, Online advertisement has become a blatant tool used by every business. The Dog Café will be promoted on Facebook, Instagram, and other social media platform.
Gifts & Vouchers: The Dog Café presents gifts and vouchers to our customers to show our appreciation for your contribution to our success.
Word of Mouth: Nowadays, word of mouth is a powerful tool that contributes an essential part to success or failure. By excellently treating every customer with our conscientiousness, we expect our positive service to be spread.
Promotional Brochure: A brochure with The Dog Café logo will be distributed, and the leaflet contains thorough information about The Dog Café.
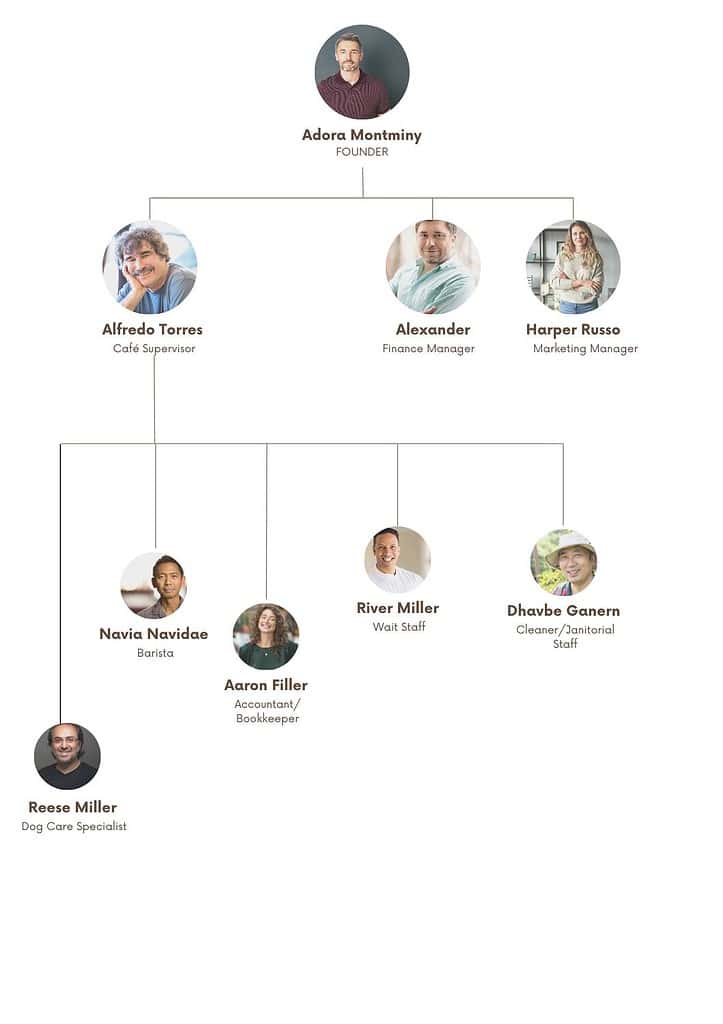
Organogram
Organizational overview in a dog cafe business plan provides a snapshot of how a company is structured and operates. It outlines the ownership structure, roles, responsibilities of key management personnel, and the reporting hierarchy within the organization. This section offers stakeholders, investors and other readers a clear understanding of the company’s leadership and its chain of command. Additionally, it may give insight into the company’s culture, values and operational philosophy.
Financial Plan
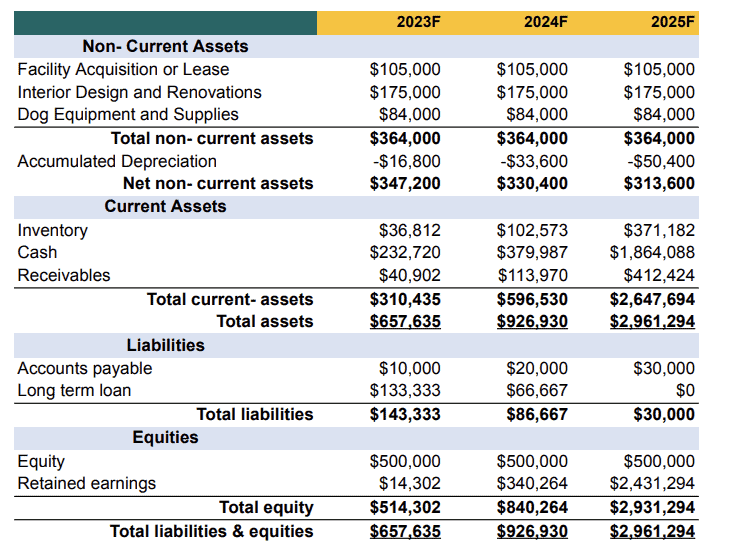
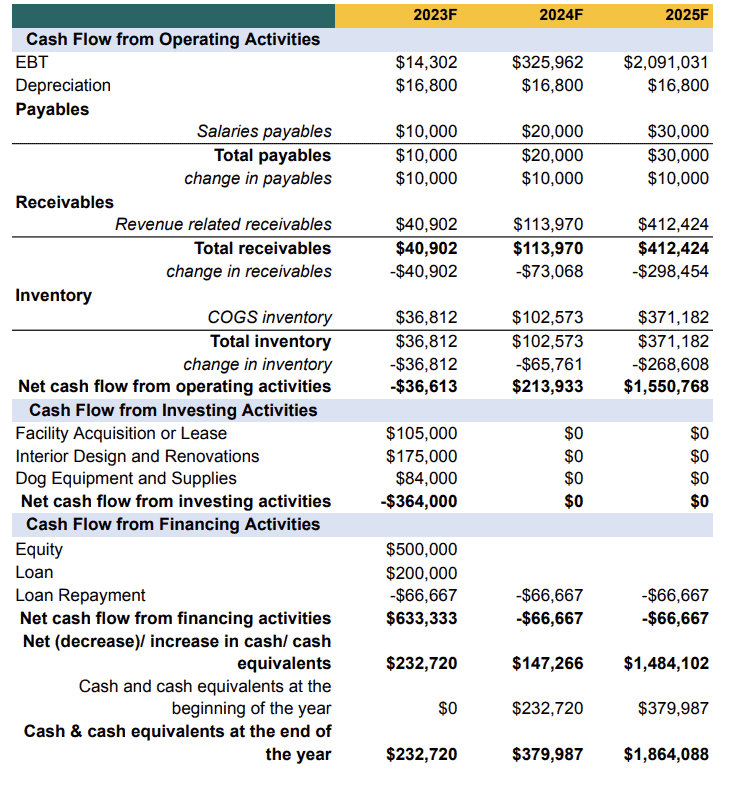
A financial plan of a dog cafe business plan provides a comprehensive projection of a company’s financial health and its anticipated monetary performance over a specified period. This section encompasses a range of financial statements and projections such as profit and loss statements, balance sheets, cash flow statements and capital expenditure budgets. It outlines the business’s funding requirements, sources of finance and return on investment predictions. The financial plan gives stakeholders particularly potential investors and lenders a clear understanding of the company’s current financial position. A financial plan helps businesses demonstrate their financial prudence, sustainability, and growth potential.
The model is built for dummies and anyone can use this with ease. Play with the numbers in the model and find out:
✔️ What happens to revenue if you increase price?
✔️ Will you run out of cash in 2 years?
✔️ Which items do you need to invest on to get started?
Access the 21 tab dog cafe financial model in Google Sheet
Income Statement
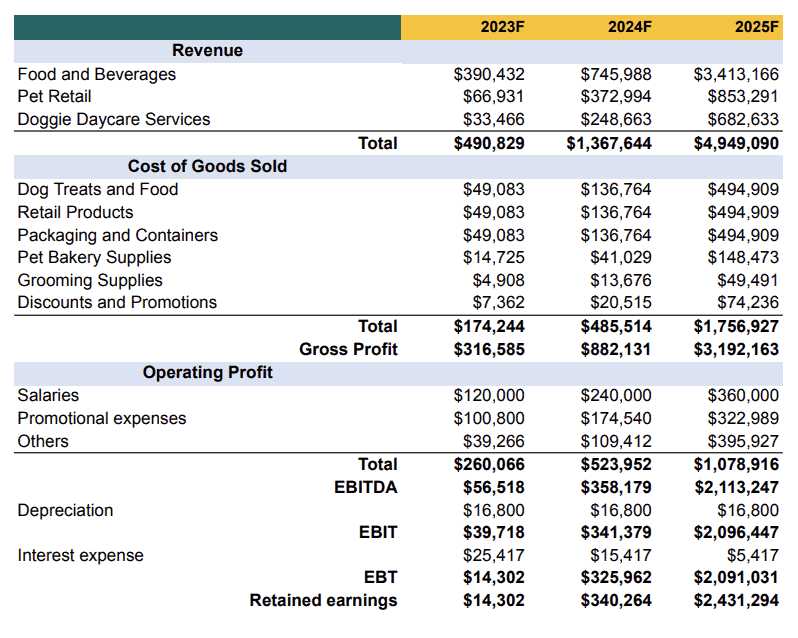
Once you DOWNLOAD the template then customize the financial model and the graphs & charts in the business plan will change automatically.
Cash Flow Statement
Balance Sheet
