Written by Elma Steven | Updated on January, 2024
How to Write a Hotel Business Plan?
Hotel Business Plan is an outline of your overall hotel business. The hotel business plan should include a 5 year financial projection, marketing plan, industry analysis, organizational overview, operational overview and finally an executive summary. Remember to write your executive summary at the end as it is considered as a snapshot of the overall business plan. You need to be careful while writing the hotel business plan as you need to consider various factors that can impact the business’s success. Read the sample hotel business plan in order to have a clear understanding of the process.
This article will provide you a step by step process to write your Business Plan. Get a free Hotel Business Plan at the end!
Executive Summary
Overview: The Spectator Hotel emanates sophistication, five-star grandeur, and personalized service from the minute you walk through the door. You’ll encounter something of a maverick boutique hotel, reflecting the southern charm and Jazz Age flair, located at the perfect junction of the City Market and the historic French Quarter. The Spectator Hotel captures the refined grandeur of the Old South and has the greatest location in Charleston’s busy historic neighborhood. Discover why we are consistently ranked among Charleston’s greatest hotels by stepping inside our elegant boutique treasure.
Mission: To deliver authentic, loving hospitality that leaves a lasting impression on every guest’s heart and mind. Our goal is to create the hotel a location where people can meet, do business, have enjoyable meetings, and have grand events.
Vision: To be the first choice of visitors by seeking to create lifelong experiences via unrivaled individualized service.
Industry Overview:
The global hotel industry, valued at around $570 billion in 2023, is witnessing a robust recovery, especially driven by the resurgence in travel and tourism. Trends towards boutique and luxury accommodations highlight a shift towards unique experiences. Technological advancements and a focus on sustainability are key growth drivers. The U.S. market is nearing pre-pandemic levels in terms of occupancy and average daily rates, signaling a positive trend for the industry.
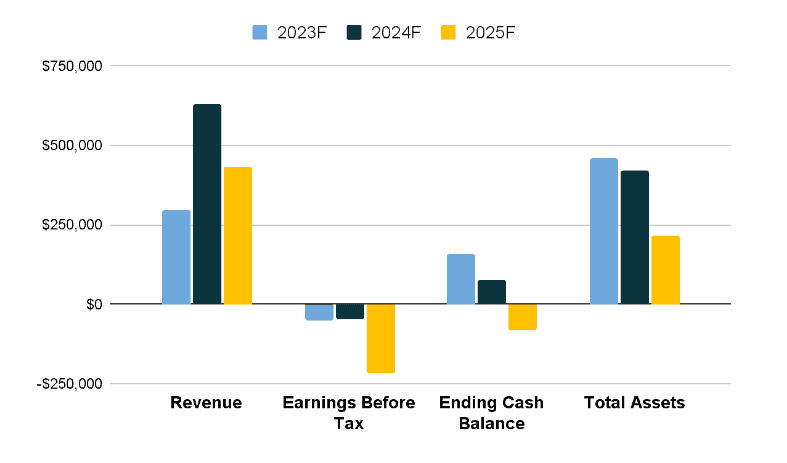
Financial Overview:
Business Description
Business Name:
Founder: Jacob Harris
Management Team:

Legal Structure: LLC
Location:
Goals:
- To achieve an average guest satisfaction score of at least 4.5 out of 5 within the first 6 months of operation by providing exceptional service and amenities.
- To increase revenue by 25% within the first year by offering special packages and promotions to attract a diverse range of guests.
- To develop a loyalty program to retain repeat customers within the first year of operation.
Products:
[Mention your services in bullet points]
Download Free Hotel Business Plan Template
Write a plan in just 2 days!
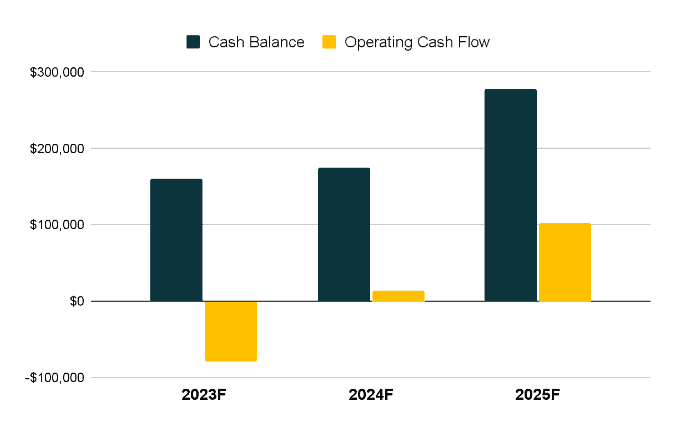
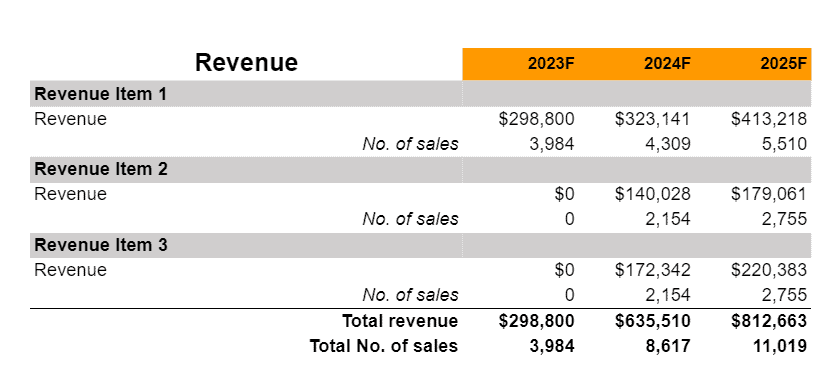
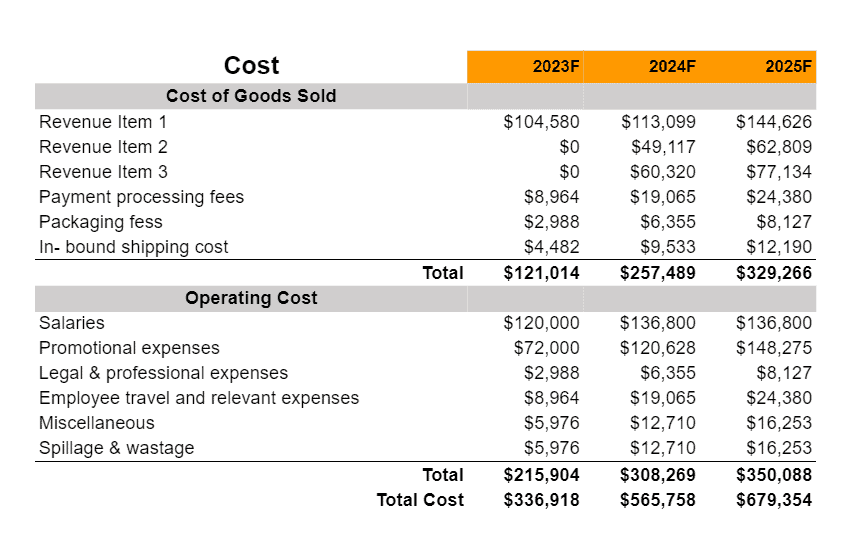
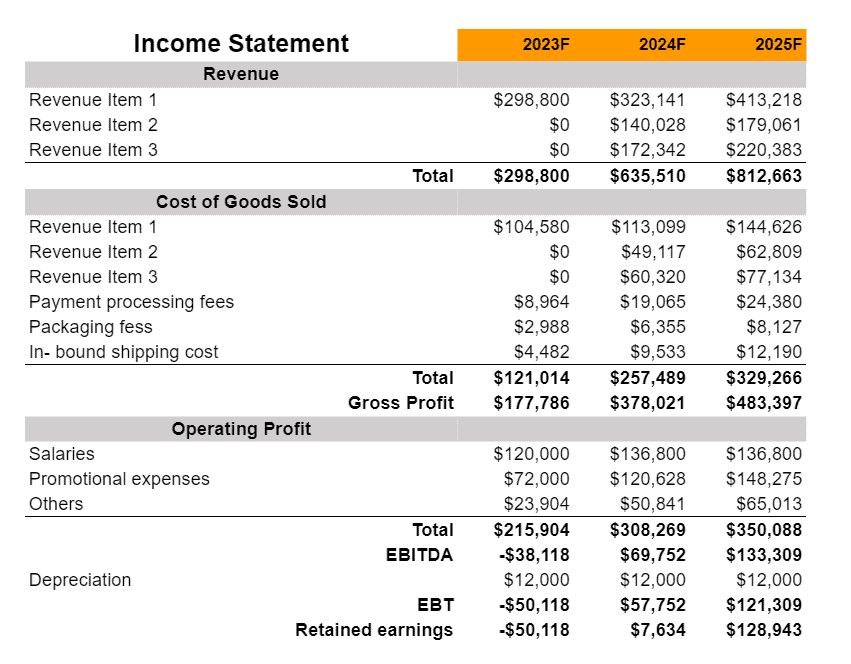
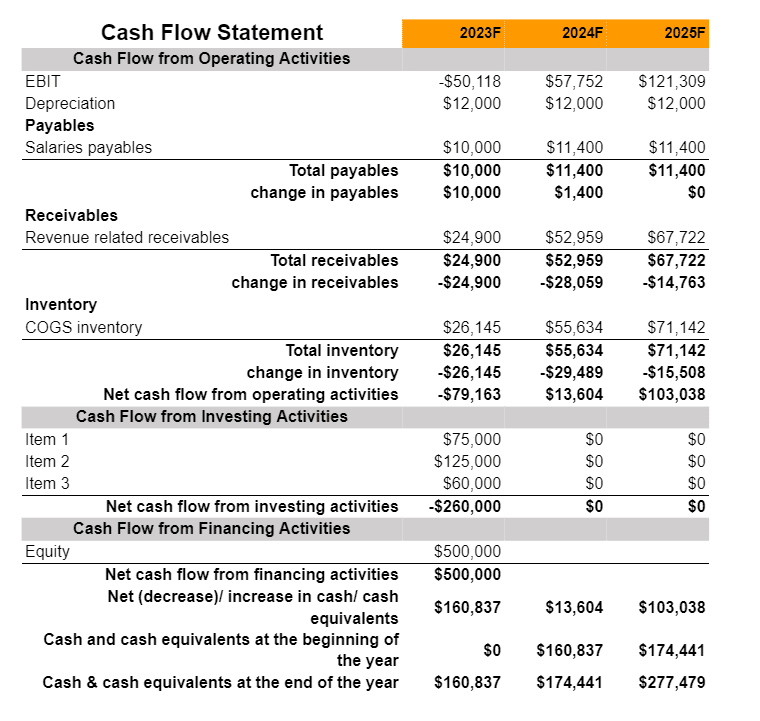
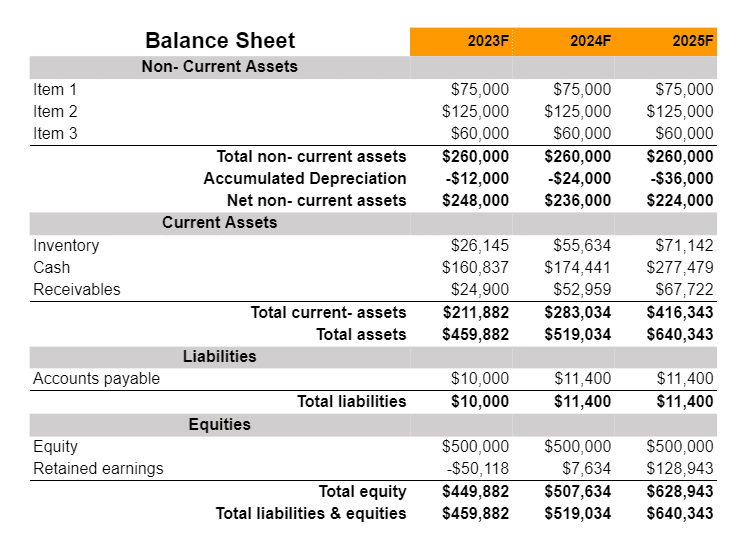
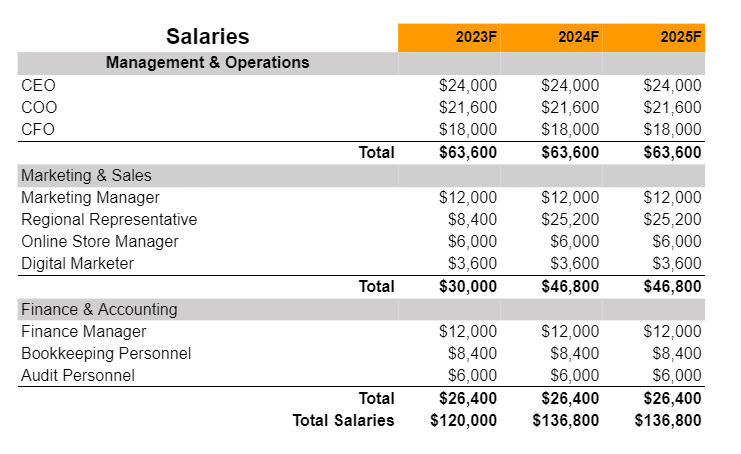
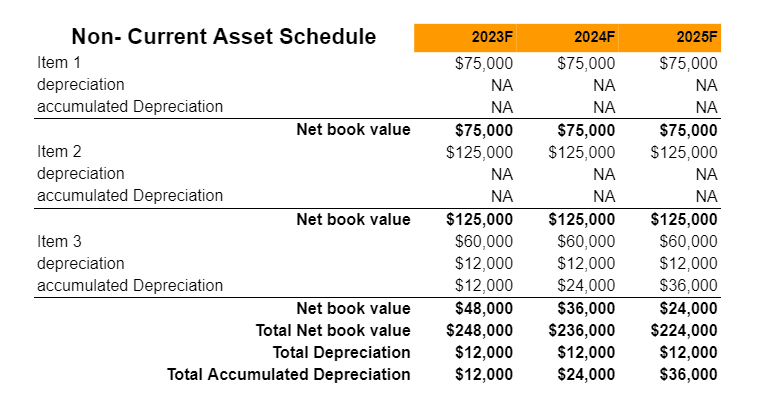
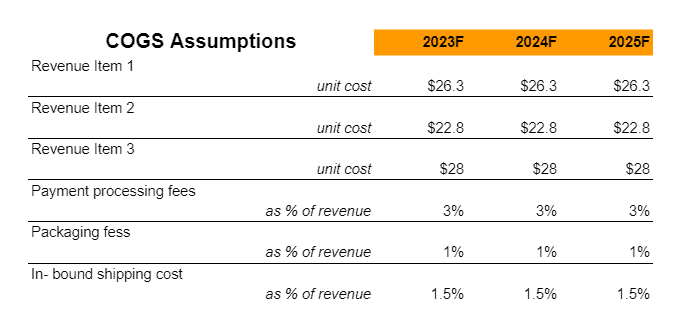
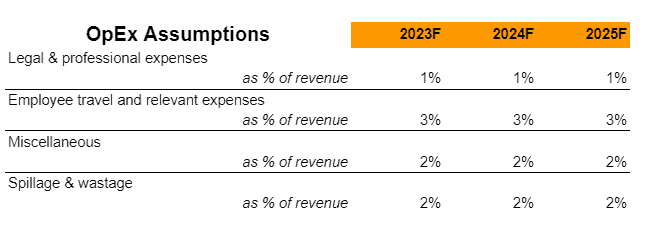
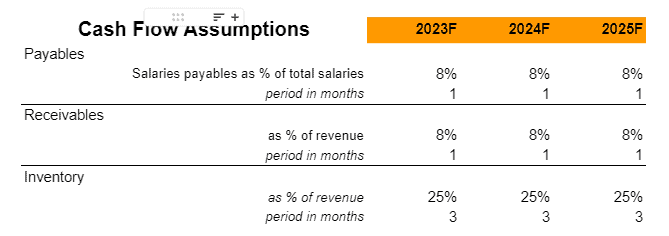
Financial Overview
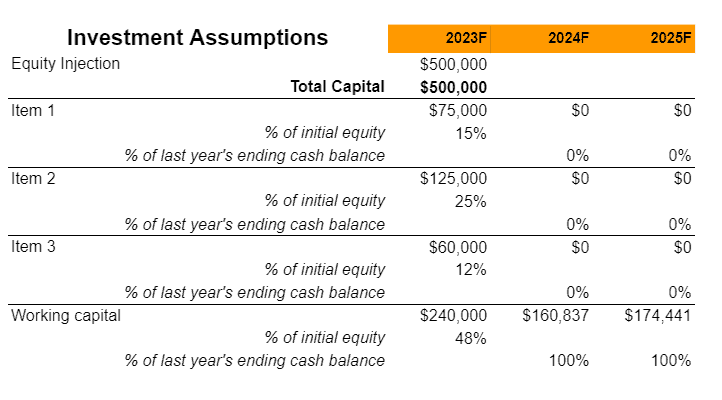
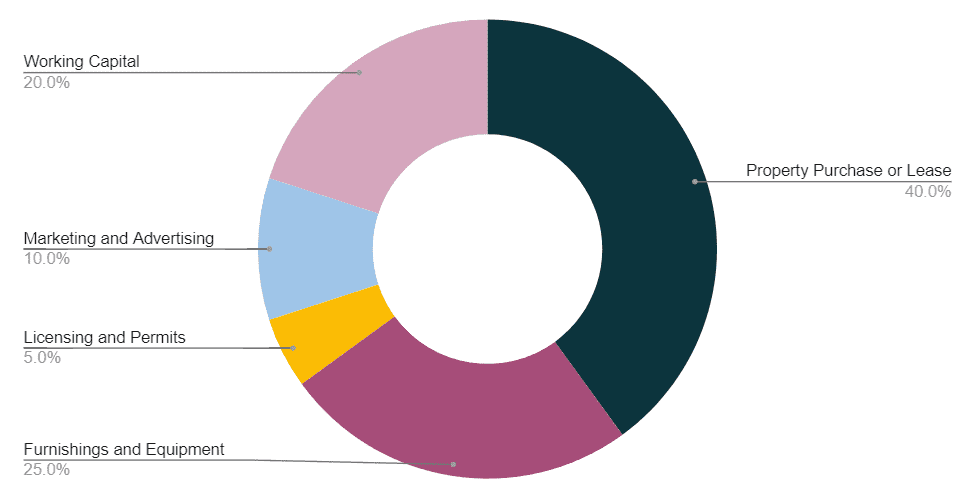
Fund Usage Plan
Key Metrics:

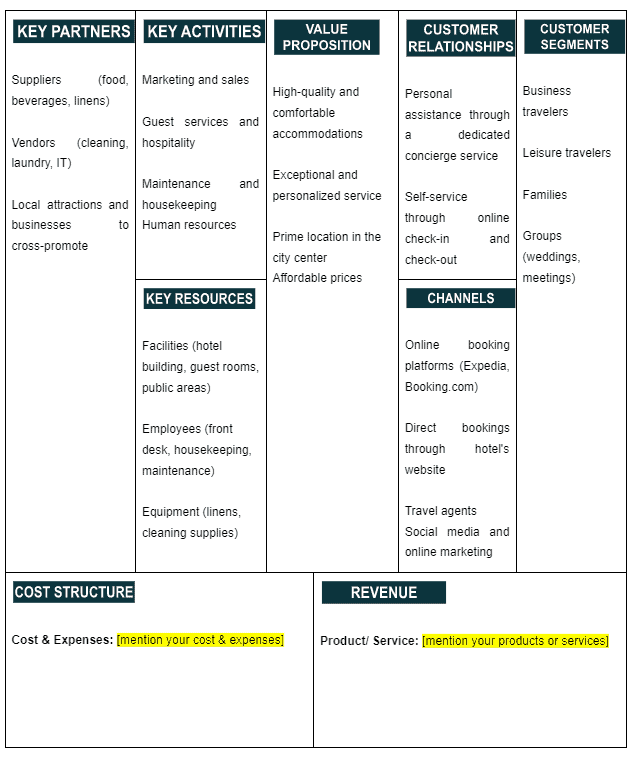
Business Model Canvas
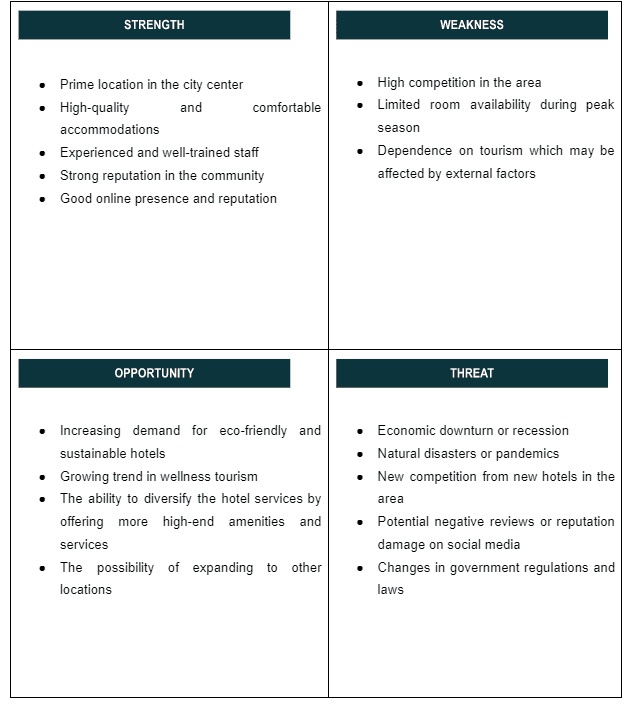
SWOT
Organizational Overview
Founder

My name is Jacob Harris, and I operate in the hospitality industry as an entrepreneur. My whole life, I’ve been called to the field of hospitality, and what drives me is the opportunity to provide life-changing memories for visitors hailing from all walks of life and walks of life. I think that a hotel is more than simply a place to stay; rather, it is a refuge of comfort, elegance, and perfect service for its guests.
Because I had such an in-depth knowledge of the factors that contribute to a stay being memorable, I decided to open my own hotel. I envisioned a place where a dedication to quality would be reflected in every facet, from the gorgeous furnishings to the individualized conveniences. For each and every one of my guests, it is one of my primary goals to provide an atmosphere that is conducive to relaxation, renewal, and a feeling of belonging.
Being an entrepreneur in the hotel industry, one of my primary goals is to provide unrivaled hospitality to my customers and to go above and beyond their expectations. I take great care to assemble a group of staff members that are enthusiastic and committed to their work and who share my goal of producing experiences that people will never forget. We go to extraordinary lengths to guarantee that each and every visitor gets customized attention and has a positive experience during their stay by providing a warm and inviting environment. It is an honor to be able to accompany them on their travels, whether they are going there for business, for pleasure, or for a significant event.
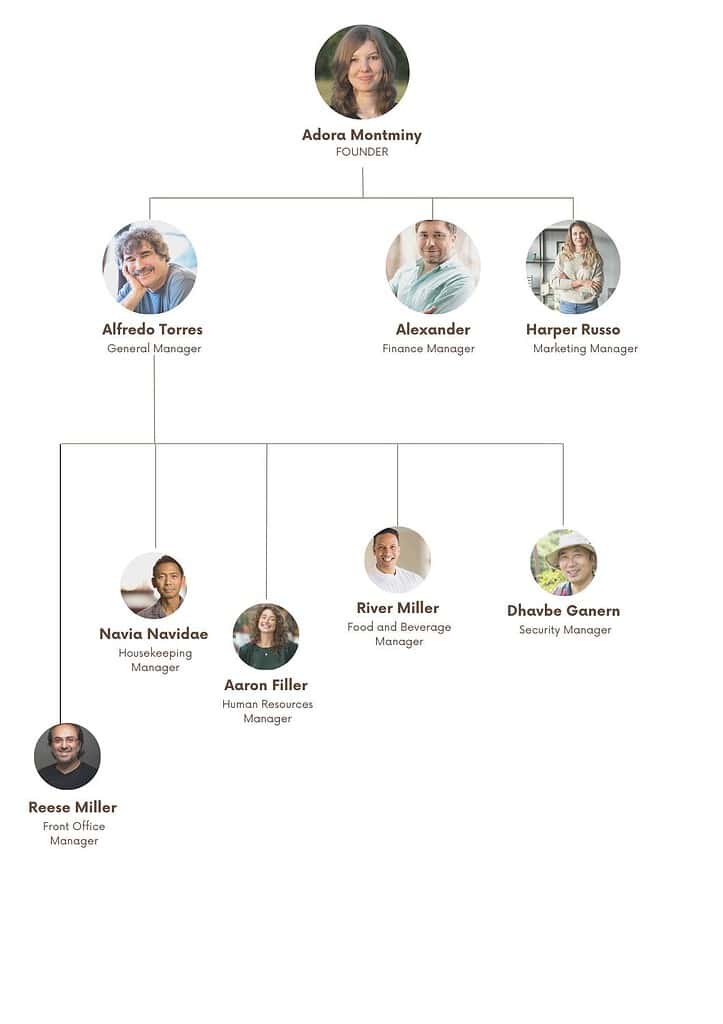
Organogram
Industry Analysis
The hotel industry is experiencing a dynamic resurgence post-pandemic, with the global market valuation reaching approximately $570 billion in 2023. This growth is primarily fueled by the rebound in global travel and tourism, a sector that has seen a significant uptick as travel restrictions ease. In the United States, the industry is nearing pre-pandemic levels, with occupancy rates and average daily rates showing encouraging signs of recovery. This trend is a positive indicator for hotels, suggesting a return to stability and potential for future growth.
A notable shift in the industry is the increasing demand for boutique and luxury hotels, driven by travelers seeking unique, personalized experiences. This trend is reshaping the market, with more hotels investing in distinctive themes, high-end amenities, and exceptional customer service to attract discerning guests. Additionally, the growing focus on sustainability and eco-friendly practices in hotel operations is influencing consumer preferences, leading to a rise in green hotels and environmentally conscious travel choices.
Technological advancements are also playing a pivotal role in the evolution of the hotel industry. Innovations such as contactless check-ins, digital room keys, and AI-driven customer service are enhancing operational efficiency and guest experiences. These technologies are not only streamlining processes but are also helping hotels to better meet the expectations of tech-savvy travelers. As the industry continues to adapt and innovate, it is poised for sustained growth, with an emphasis on experiential, sustainable, and technology-driven offerings.
MARKET SEGMENTATION IN THE US HOTEL INDUSTRY
BY TYPE
- Independent Hotels
- Chain Hotels
BY PRICE SEGMENTATION
- Service Apartments
- Mid and Upper Midscale Hotels
- Luxury Hotels
- Budget and Economy Hotels

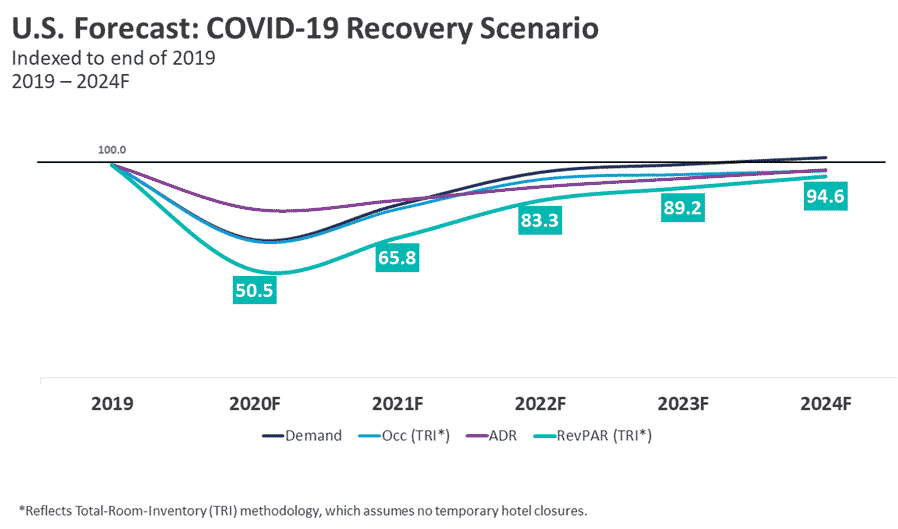
The hotel and motel industry in the United States was valued at 93.07 billion dollars in 2016, down from 210.74 billion dollars the year before. This industry is expected to grow to a market size of 133 billion dollars by 2021. During the five years leading up to 2021, the Hotel and Motel business has seen a lot of instability. Hotels and motels generally serve patrons with short-term housing; however, many provide other services and amenities to diversify income. Industry income expanded at a steady pace most of the time, owing to favorable economic conditions that benefited the domestic economy as a whole. However, when the COVID-19 (coronavirus) pandemic swept over the world in early 2020, this trend abruptly reversed, resulting in a significant drop in industry income for the year.
The recovery of the Hotel and Motel business is expected to be biased toward domestic leisure markets now that COVID-19 (coronavirus) restrictions have been relaxed. Truckers, contractors, construction workers, healthcare personnel, and others who must travel for work and cannot do their job remotely are expected to see a rise in demand. Travel to the US from essential markets like Canada and the European Union has remained sluggish. Revenue growth for the sector is expected to slow in 2021 as a result.
The development of the travel and tourism sector, which is driving the worldwide hotel market, is being fueled by a rise in consumer spending power, economic growth, digital innovation, and increased internet use. People’s travel frequency has grown dramatically during the last several years, whether on a national or worldwide scale.
The rise of shared lodging supplied by specific market competitors is predicted to have a negative influence on the hotel industry’s development. In comparison to chain hotels, these shared housing service providers have reduced overhead expenses, allowing them to give a more customized experience at a cheaper cost to their consumers. The low cost of shared housing services has a negative influence on hotel income; however, the impact varies depending on which segment of the hotel industry is being considered. Furthermore, the market for chain hotels is expected to be harmed by continuous improvements in the quality of shared housing options.
The market is divided into two types: individual and chain, based on the business model. Chain hotel revenue is predicted to rise from US$ 74 billion in 2019 to US$ 178.6 billion by 2027. This movement demonstrates that stakeholders in the hotel industry are shifting their investments from independent hotels to chain hotels. Owners of hotels are streamlining operational procedures for managers by employing predictable and affordable tariffs for customers with the help of innovative digital devices and advanced software technology, as the trend of chains/franchises is gaining traction in upscale and midscale-level hotels. Hotel owners are attempting to provide end-to-end solutions for hotel managers by enabling them to generate more money.
By 2027, North America is estimated to command a market share of US$ 253 billion. Due to increasing demand, branded hotel conglomerates and independent hotels are investing heavily in small hotels in North American cities, followed by Asia, the Pacific, and Europe. In January 2019, for example, Marriott International, a renowned American global competent hospitality firm, announced the opening of its Moxy hotel brand in the Southeast United States. These are the major elements that will propel the North American region’s expansion in the worldwide market over the next few years.
New developments in the hospitality business, according to industry analysts, will totally redefine how hotels serve their customers. Guests are becoming used to these sophisticated features in today’s technological environment. As a result, the hotel sector is expected to follow suit. Slowly but slowly, the hotel business realizes that staying current with the newest developments in the industry is critical for taking advantage of opportunities and standing out in a crowded market. As a result of the significant shifts in guest preferences and expectations, all hotels (from small to big) are continually researching innovative approaches to provide the best possib
Marketing Plan

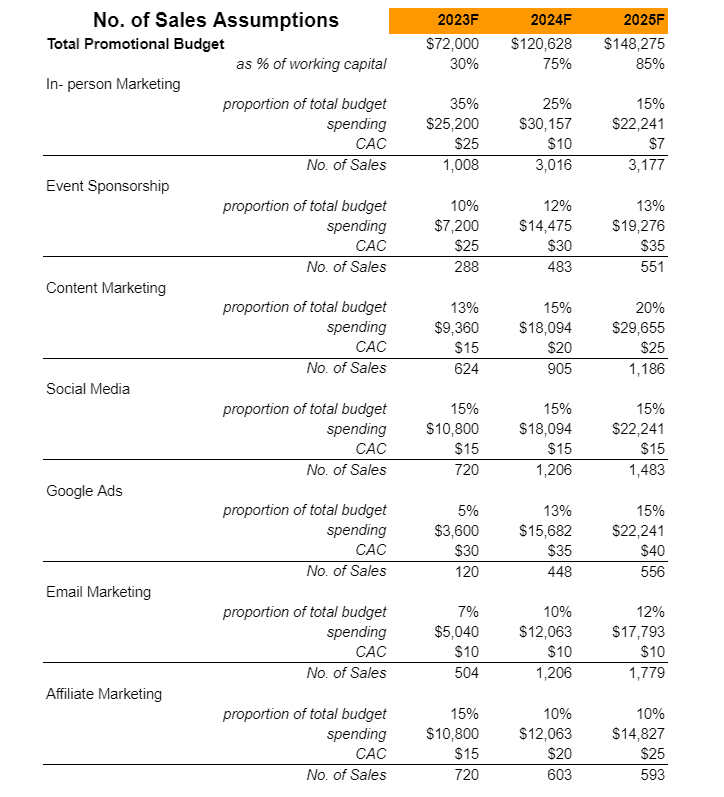
Content Marketing: Create a blog on your Blackbird Acupuncture website on what you has to offer to prospective customers.
Discounts: Provide multiple rewards or incentives to Blackbird Acupuncture‘s frequent customers, you’ll be more likely to attract them. Create a member referral scheme, for example, where members get a discount if they successfully recommend someone.
Social Media: Engage and promote Blackbird Acupuncture on Twitter, publish news on Facebook, and utilize Instagram to promote curated photos of your clinic.
SEO (Search Engine Optimization) Local SEO makes it easier for local consumers to find out what you have to offer and creates trust with potential members seeking for what your clinic has to offer.
Email Marketing: Blackbird Acupuncture will be sending automated in-product and website communications to reach out to consumers at the right time. Remember that if your client or target views your email to be really important, they are more likely to forward it or share it with others, so be sure to include social media share.
Financials
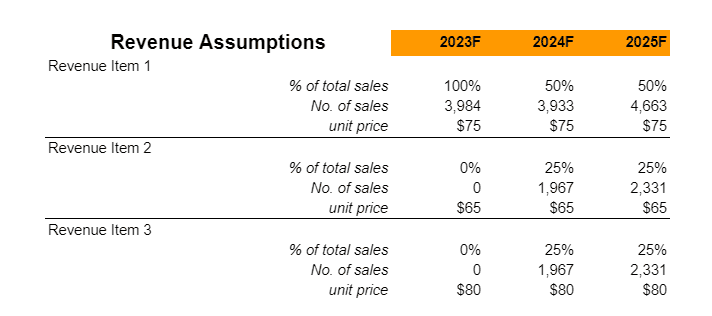
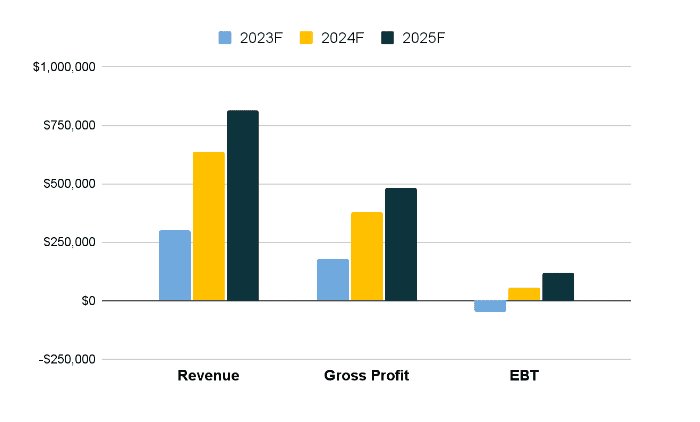
Earnings
Liquidity
