Written by Elma Steven | Updated on January, 2024
Executive Summary
Overview: American Apparel has provided customers with high-quality essentials for the last fifteen years. Our journey begins in North Carolina, where we started as a modest wholesale company dedicated to providing the greatest American-made t-shirt at an accessible price. Our design’s minimalism, unique color palette and simplicity, and the broad have established American Apparel as a pioneer in the wholesale market and the whole garment industry.
Mission: To produce high-quality garments without relying on low-cost “sweatshop” labor or exploiting employees. We make our t-shirts in the United States not because we’re passionate flag fans but because it’s the world’s most lively T-shirt market, and hence the most efficient location to make them.
Vision: To be the best and most prominent brand in the industry committed to high-quality products, Arts, designs, and Technology.
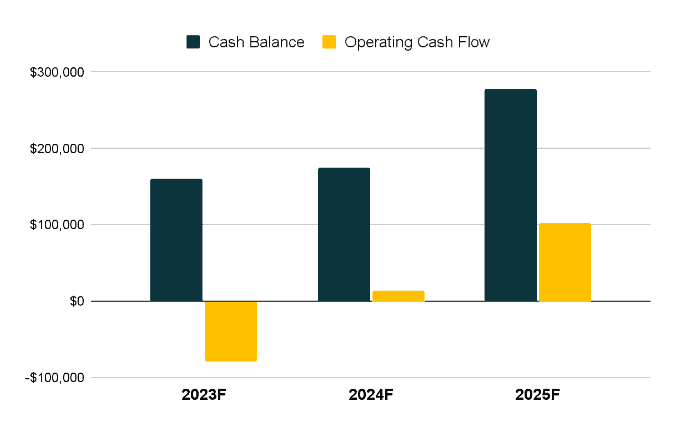
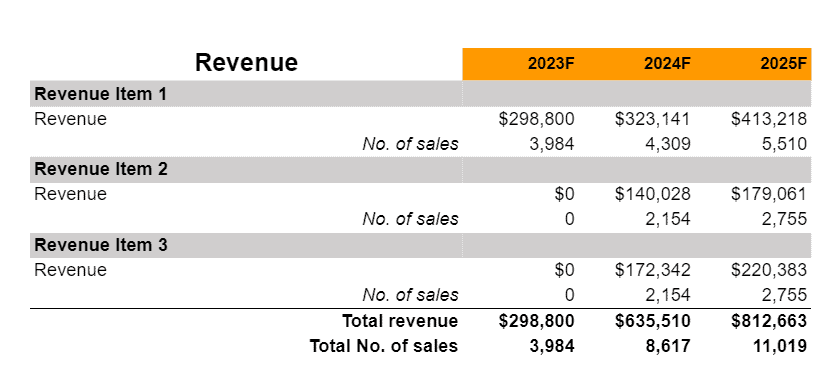
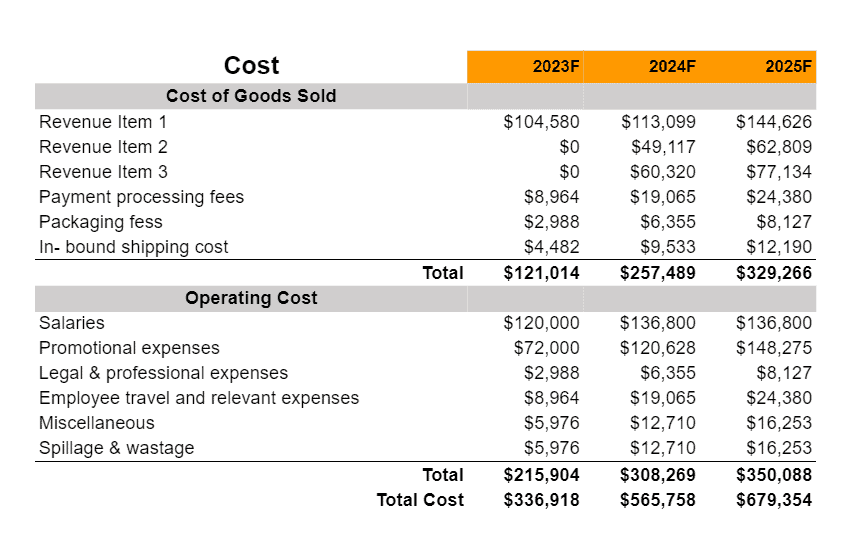
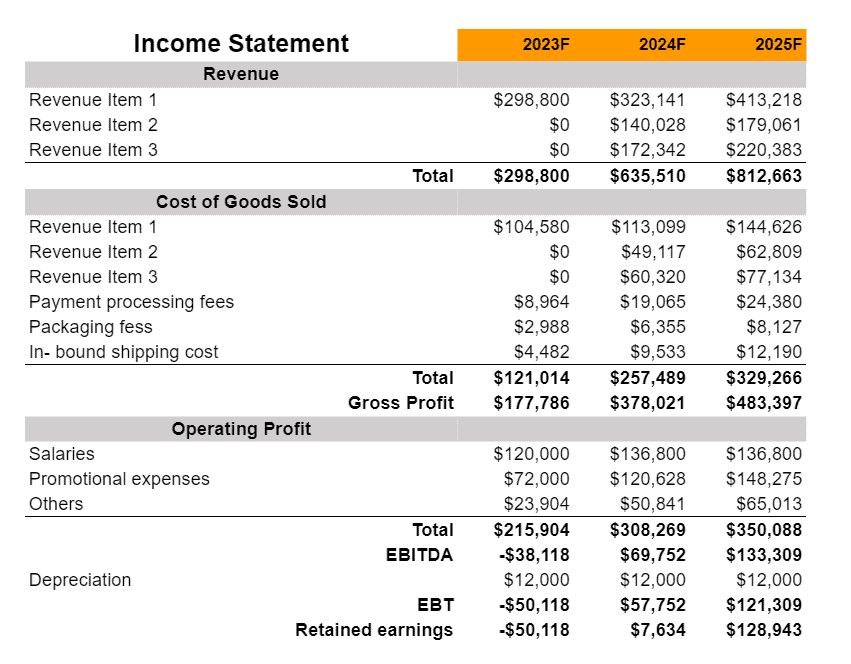
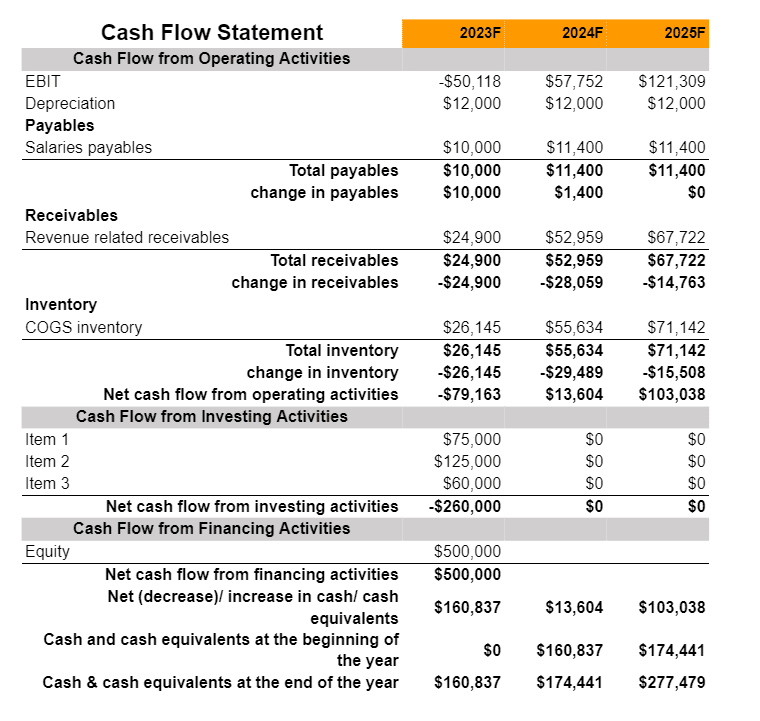
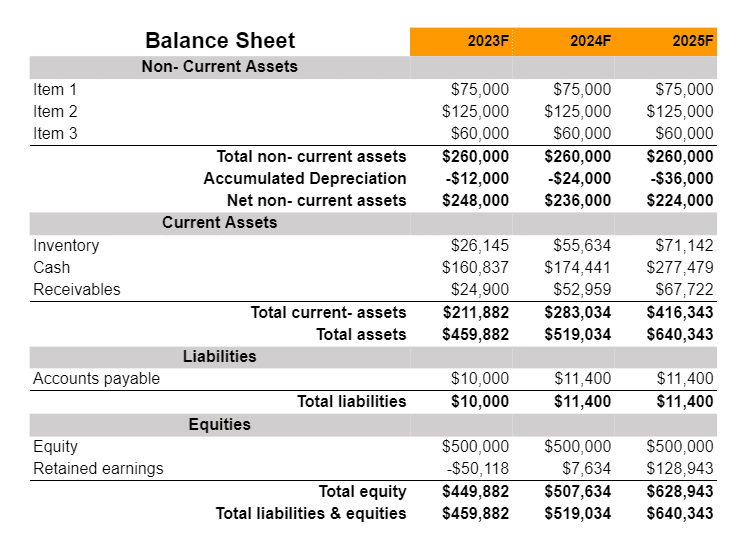
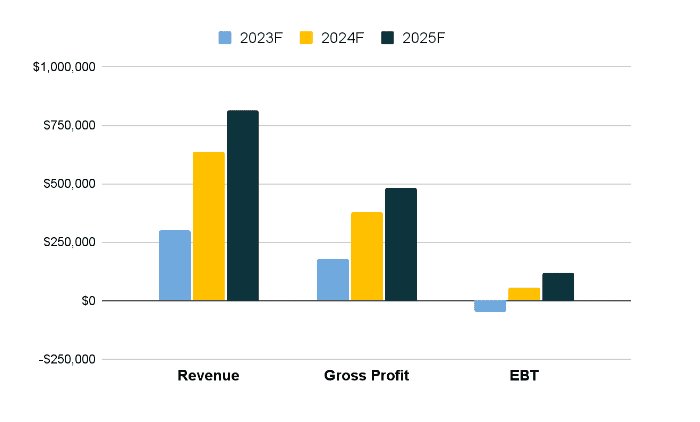
Financial Overview:
Industry Overview:
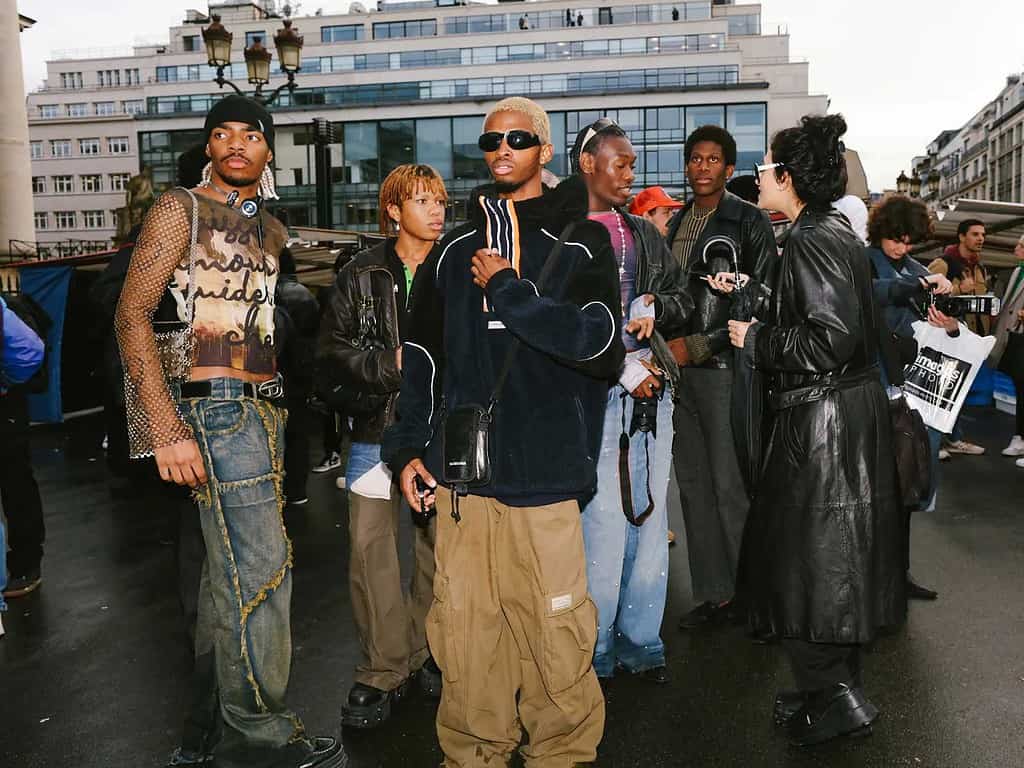
The advent of streetwear might be considered a lifestyle rather than a fad.’ The streetwear sector is one of the world’s most thriving industries. Many individuals feel that streetwear is the next fashion revolution and will continue to develop. According to fashion experts, streetwear sprang from and continues to be popular among fans of popular culture. People want to dress in clothing that is both comfortable and stylish. The variables that lead to the success of the streetwear sector are included in this definition. This industry’s tendency is for fashion to be coupled with comfort.
Business Description
Business Name:
Founder: Jacob Harris
Management Team:

Legal Structure: LLC
Location:
Mission: “Our mission at [Streetwear Co.,] is to provide streetwear enthusiasts with fresh, high-quality clothing and accessories that reflect the latest urban fashion trends, while fostering a sense of community among our customers and promoting self-expression through fashion.”
Vision: “Our vision is to be the leading streetwear brand, renowned for our innovative designs, exceptional customer service, and positive impact on the fashion industry by promoting diversity and inclusivity in our products and community.”
Goals:
- Increase brand awareness and customer loyalty through targeted marketing campaigns and collaborations with influencers and other brands.
- Continuously innovate and improve product design and quality to stay ahead of current fashion trends.
- Foster a positive and inclusive company culture that values diversity and promotes social and environmental responsibility.
Products:
[Mention your services in bullet points]
Download Free Streetwear Business Plan Template
Write a plan in just 2 days!
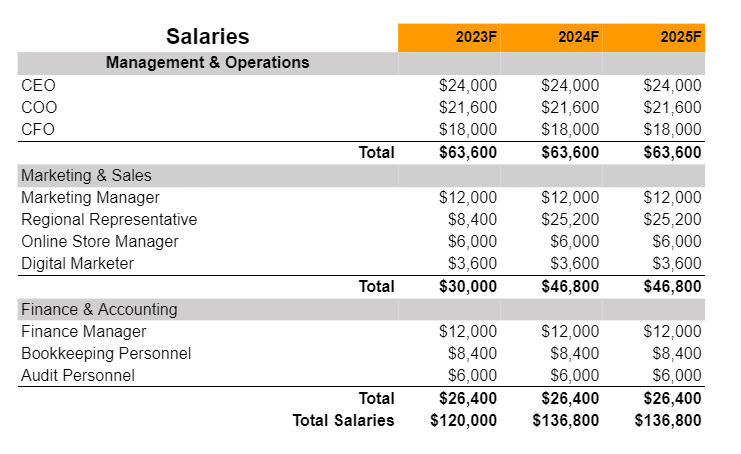
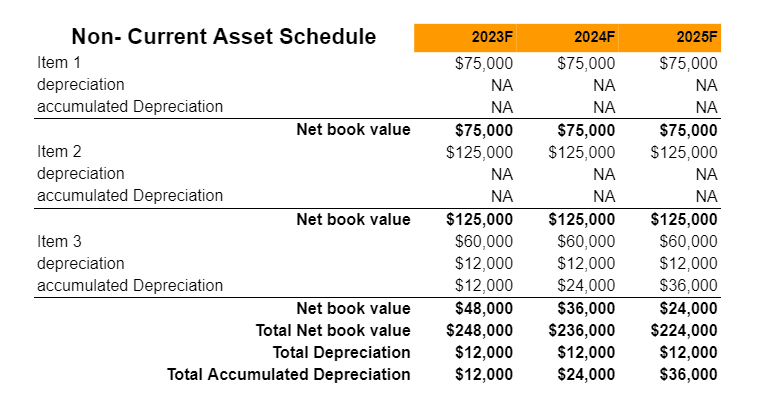
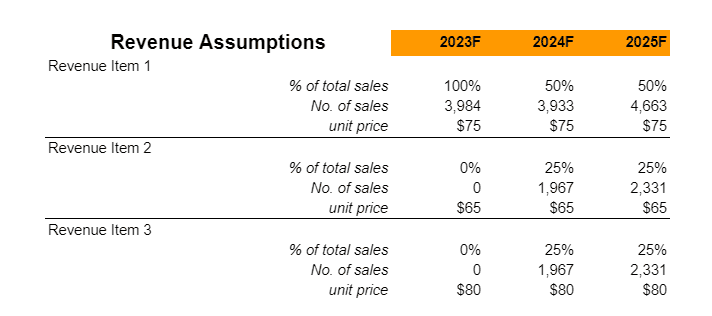
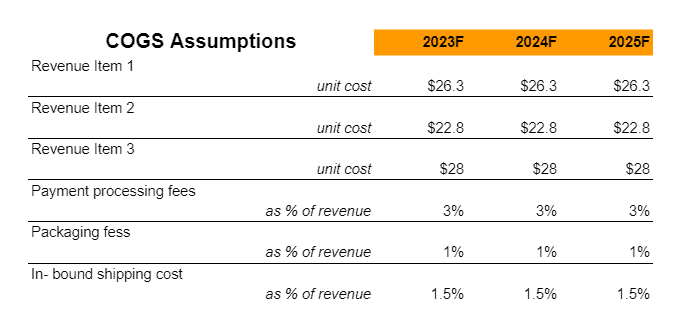
Financial Overview
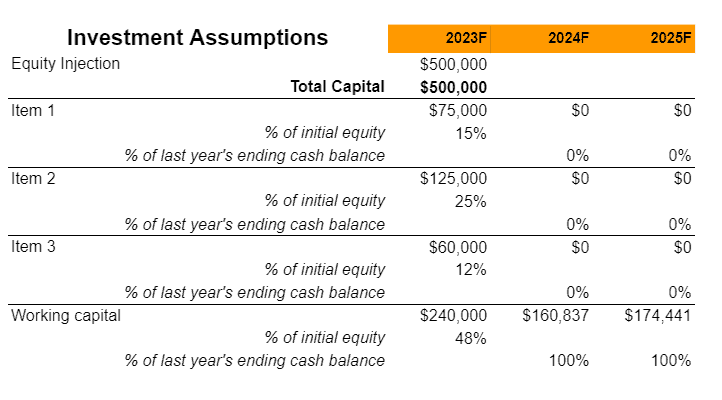
Fund Usage Plan

Key Metrics:

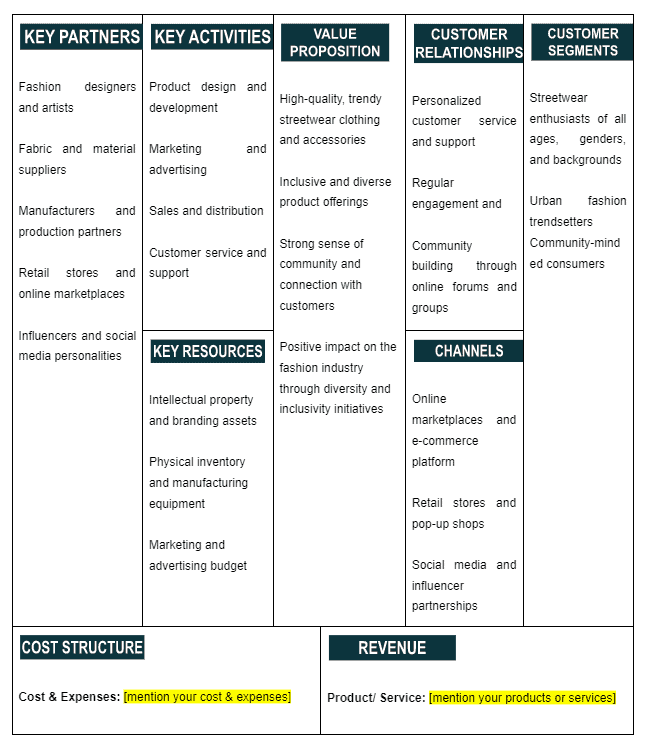
Business Model Canvas
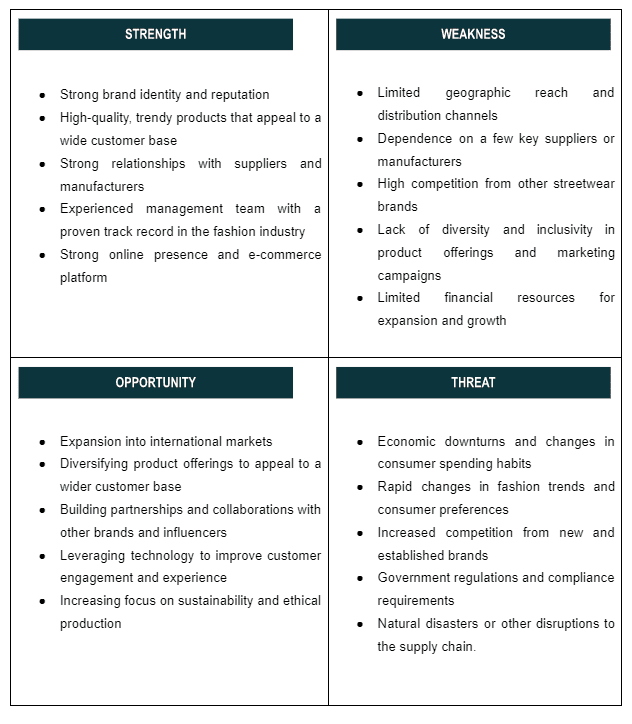
SWOT
Organizational Overview
Founder

My name is Jacob Harris, and I own a business that specializes in selling streetwear. As a child who spent my formative years surrounded by urban culture and the fashion scene, I acquired a profound respect for streetwear as a potent form of self-expression, which led to the formation of my own personal style. My goal was to establish my own streetwear brand, and I was motivated to do so by the dynamic nature and rapid progression of the industry.
I started my own streetwear label because I have a deep-seated love for being creative and an excellent sense of personal style. In my opinion, streetwear is more than just a type of clothes; rather, it is a way of life that exemplifies originality, confidence, and a true connection to the city. I take great effort in curating each collection, which entails combining one-of-a-kind designs, high-quality materials, and meticulous attention to detail, in order to produce clothing that are in tune with the ethos of the street.
As the owner of a streetwear business, I have made it my personal mission to provide my clients with products that are unique and of high quality. I am aware of the significance of monitoring the current state of the urban fashion scene and ensuring that I am always one step ahead of the trends. I want the items that I design to give people the confidence to be themselves, to make a strong statement about who they are in their everyday lives, and to express their distinct identities via the way they express themselves.
Organogram

Industry Analysis
In 2017, the streetwear market was estimated to be worth over 309 billion dollars, and it has continued to grow in popularity. Supreme, Fear of God, Kith, Yeezy from the United States, Off-White from Italy, and Bape from Japan lead the streetwear market. Demand and scarcity are at the heart of these streetwear behemoths’ principal business approach. To build “buzz” and emotions of exclusivity among consumers, companies cultivate a dedicated following and sell limited-edition items with high price tags. As previously stated, Asia and the United States are the world’s leading consumers of streetwear products, with Korea, the United States, China, and Japan at the forefront. The appeal of streetwear is broad—Target just debuted a budget-friendly streetwear brand, while Lululemon in Canada launched a streetwear line.
Secondary market firms like StockX, the GOAT app, and Grailed—all based in the United States—have helped spread streetwear’s business throughout the world, boosting consumer accessibility and integrity via buying “verifications” and platforms. Secondary markets have enormous potential to change how people buy commodities that aren’t one-of-a-kind or mass-produced, and their success is shown by the rapid growth each business has achieved in only a few years.
Finally, the streetwear industry is quite popular right now all around the globe. Its adoption by well-known commodity companies has further fueled the fire, with brand partnerships becoming more prevalent. Off-White and Nike just teamed together to create some of the most sought-after clothing in the world. This impact will be amplified by the extra influence of celebrities from all around the globe who favor streetwear fashion. Streetwear seems to be more than just a fad and is here to stay.
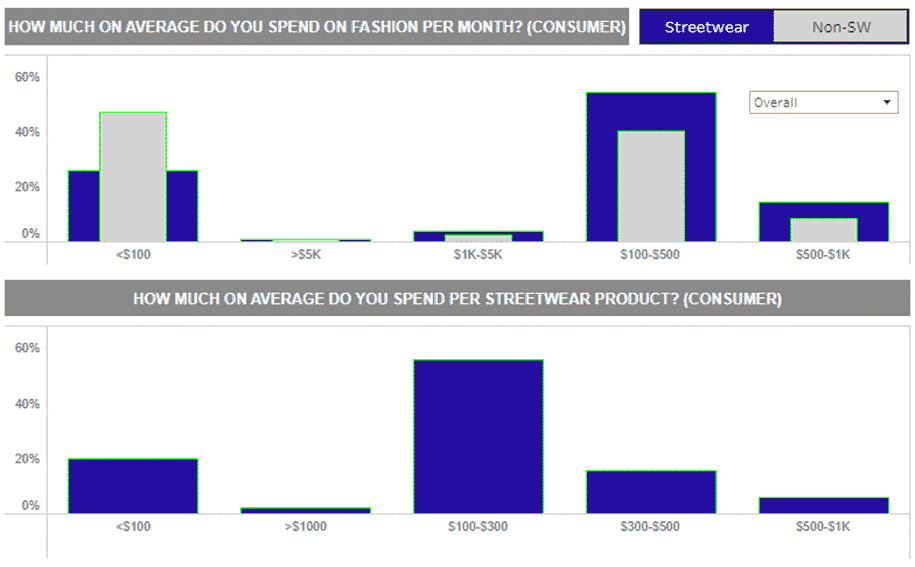
In our worldwide consumer survey, about 70% of respondents said their yearly income was $40,000 or less. Despite this, some shoppers are keen to purchase. Just over half of customers (54%) said they spend $100-$500 on streetwear each month, with another 18% saying they spend more than $500.According to our poll, a large number of people – 56 percent – said they spent an average of $100-$300 on a single piece of streetwear. Another 16% said they spent between $300 and $500 on average. Only 8% of respondents stated they would purchase things costing $500 or more, indicating that high-end luxury items are out of reach for many streetwear shoppers polled.
Lower-income respondents, in particular, were ready to spend up to five times as much per month on streetwear as they were on non-streetwear items. Male respondents reported spending somewhat more than female respondents, whereas non-gender-binary respondents reported much greater expenditure. Almost half of the industry respondents (49%) stated their customers’ typical monthly expenditure was $100 to $500, which matched consumer reports. These findings indicate the optimal margin for addressing the streetwear market.
The streetwear industry’s fan base is diverse, covering various ethnicities, subcultures, income levels, socioeconomic variables, and geographic locations. One of the major reasons for the streetwear industry’s enormous success is its variety. People who like street fashion are mostly between the ages of 22 and 30. They also belong to a subculture, which gives them a feeling of self-identity and social acceptance. Southern California is regarded to be the birthplace of streetwear fashion. In the 1980s, a surfer began selling t-shirts with the same printed pattern as his surfboards to advertise his company. It gradually became a source of inspiration for others. As a result, streetwear fashion was born. In the 1990s, skating businesses in New York followed the trend and began printing their items in the same surfer’s style. Sneaker culture was the next big thing in the streetwear business. In the early 2000s, influencers, celebrities, and fashion models were all spotted endorsing high-end shoes. In the early 2000s, a new style of high-end streetwear began to gain traction. The younger generation marketed and pushed streetwear. This encouraged the fashion industry, as well as luxury labels such as Nike and Gucci, to quickly embrace streetwear fashion.
High demand for the goods flows into the resale market since the commodity enters the secondary market at inflated rates due to low retail pricing. As an example, Streetwear is one of the most noticeable retail and fashion trends of recent years, comprising the manufacturing, marketing, sale, and resale of casual clothing outside of regular retail channels. Customers are often encouraged to be the first to acquire things that are exclusively accessible directly from the company, either in-store or online, using social media. The anticipation of a limited-time opportunity to purchase contributes to a close, even cult-like bond between streetwear firms and their customers.
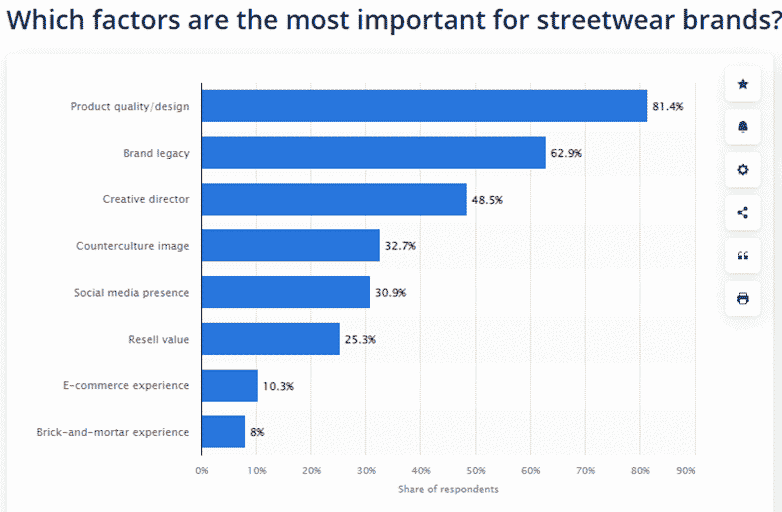
This has aided in the transformation of streetwear from a flashy fashion trend inspired by the counterculture of the 1980s and 1990s into a multibillion-dollar retail business. The worldwide streetwear market is estimated to be about $185 billion in sales*, accounting for around 10% of the total global clothing and footwear industry. Some of the most renowned established businesses in the retail and luxury goods industries, as well as the fashion industry in general, have taken notice of streetwear’s influence – both on retail culture and the numbers involved. Players in the streetwear scene come from a variety of backgrounds in the fashion business. There are pure streetwear labels, and athletic companies are expanding their conventional sports equipment range into a rising streetwear portfolio with the notion of stylish, hip shoes and hoodies. Furthermore, premium companies attempt to establish a big presence in the streetwear industry.
This is mostly because it introduces a whole new target demographic of younger customers. The majority of streetwear’s readership is under the age of 25. A second reason for established companies’ interest is that streetwear has changed how fashion trends spread. Insiders have always served as gatekeepers to the latest fashions and trends in the fashion business, which has traditionally worked on a top-down paradigm. This has been flipped on its head by streetwear.
Marketing Plan

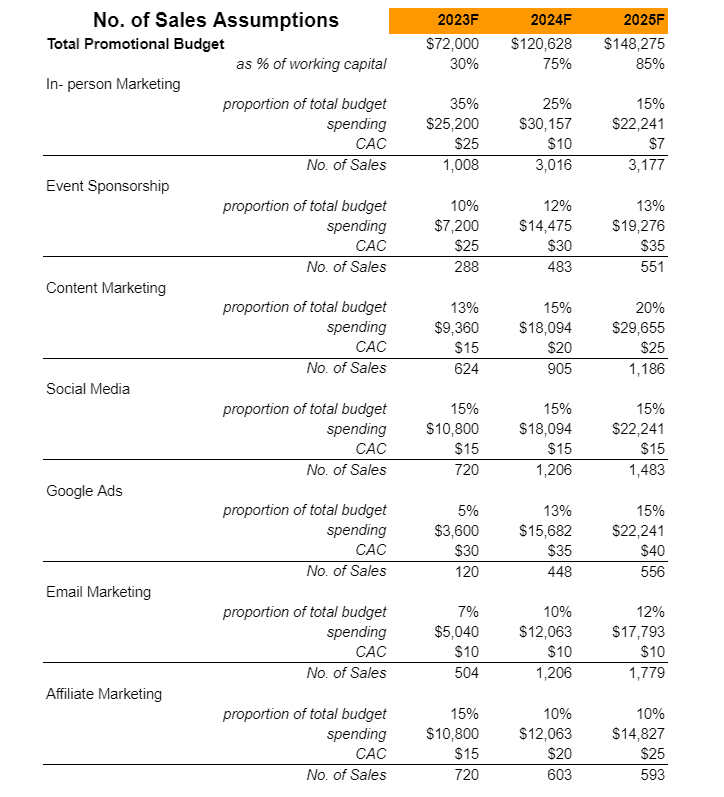
Content Marketing: Create a blog on your Blackbird Acupuncture website on what you has to offer to prospective customers.
Discounts: Provide multiple rewards or incentives to Blackbird Acupuncture‘s frequent customers, you’ll be more likely to attract them. Create a member referral scheme, for example, where members get a discount if they successfully recommend someone.
Social Media: Engage and promote Blackbird Acupuncture on Twitter, publish news on Facebook, and utilize Instagram to promote curated photos of your clinic.
SEO (Search Engine Optimization) Local SEO makes it easier for local consumers to find out what you have to offer and creates trust with potential members seeking for what your clinic has to offer.
Email Marketing: Blackbird Acupuncture will be sending automated in-product and website communications to reach out to consumers at the right time. Remember that if your client or target views your email to be really important, they are more likely to forward it or share it with others, so be sure to include social media share.
Financials
Earnings
Liquidity
