Written by Elma Steven | Updated on January, 2024

Executive Summary
Overview: Sky Sports will be owned by Jeff Leon. Jeff had been the soccer club’s manager for eight years, but his adventurous spirit has now driven him to build a trampoline park. Jeff is well-known in his hometown for his leadership abilities and genial, cheerful demeanor. He is a driven individual who is eager to put both money and time into the business of his choice. Sky Sports will be a registered and regulated outdoor trampoline park in Lansing, Michigan, about 10 minutes from Deluca’s Restaurant. An 8-acre property will be transformed into a trampoline park by constructing trampolines of various sizes in order to launch a trampoline park for various age groups.
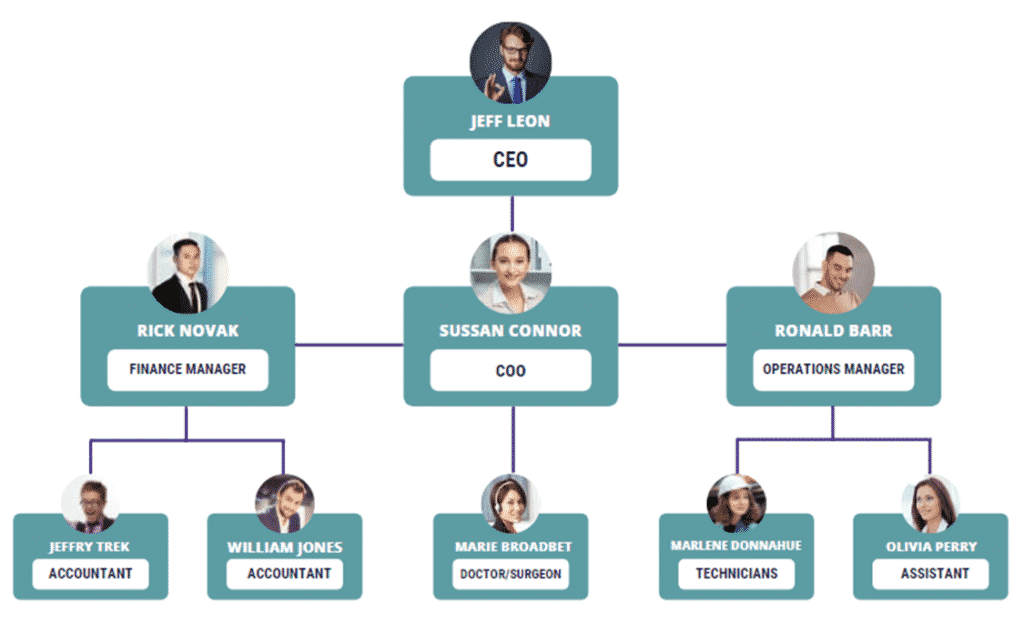
Jeff will assemble a group of people that are passionate, hardworking, and dedicated, and who will be able to generate positive work energy every day. Technicians, cleaners, cashiers, greeters, doctors, and general staff will be part of the team.
After earning expertise and notoriety as a great manager, Jeff has decided to start a business that he is passionate about and will profitably operate. According to Jeff, amusements such as trampoline parks are a sign of a healthier society, and a person of his caliber would be the best candidate to lead such a business.
An 8-acre plot of land will be turned into an outdoor trampoline park, with small and large trampolines installed. This firm will require a significant amount of capital to begin operations, including the purchase of trampolines, the installation of foam on the walls and floors, the establishment of a snack bar and beverage service for clients, and the acquisition of merchandise.
Mission: Sky Sports’ mission is to become a forward-thinking leader in the family entertainment business.
Vision: Our vision is to create a world-class outdoor trampoline park that is more than simply a trampoline park, but also a place where families can create memories in a safe, enjoyable, clean, and affordable setting.
Industry Overview: The global trampoline market is divided into segments based on product type, end use, and distribution channel. The global trampoline market has been divided into round, rectangular, square, spring free, and rebounder segments based on product type. The market has been divided into commercial and residential segments based on end use. Due to a growth in sport activities in various nations, commercial trampolines are expected to acquire a big portion of the market. The market has been further categorized based on distribution channel, with online distribution and offline distribution being the two options. Hypermarkets and specialty stores have been added to the offline distribution route. Because of the increasing internet facilities, easy convenience, and easy delivery alternatives, the online distribution channel has attracted more attention over the years and is expected to have the fastest growth.
The worldwide trampoline market is primarily driven by an increase in the number of trampoline parks, as well as improved raw materials utilized to improve product qualities. However, issues arising from a lack of awareness about correct trampoline use are limiting the worldwide trampoline market. If proper guidelines are not followed when using a trampoline, it might result in serious mishaps. Several safety measures are provided by organized clubs and gyms, including safety end decks with adequate foam padding at each end.
North America, Europe, Asia Pacific, Middle East, Africa, and Latin America are the regions studied in the worldwide trampoline market. North America includes the United States. Canada is expected to take a substantial share of the market due to parents’ increasing awareness of the importance of physical activity for their children. Due to the rising number of sport activities and athletes competing in Olympic regions, the Asia Pacific region, which includes China, India, Japan, and Australia, is expected to see the fastest growth. Europe, which includes Germany, France, and Italy among other countries, has also held a significant market share over the years due to better E-retailing services and a growing number of company online websites.
Strategic acquisitions and joint ventures are used by the major players in the global trampoline market to gain a significant share of the industry. Jump Sport, Pure Fun, Skywalker Holdings, Spring free Stamina Products, Upper Bounce, and Y J Corporation are among the industry’s leading players on a global scale.
The study provides a thorough analysis of the market. It accomplishes this through in-depth qualitative insights, historical data, and credible market size predictions. The report’s estimates are based on well-established research methodology and assumptions. As a result, the research study serves as a repository of analysis and data for all aspects of the industry, including but not limited to regional markets, technology, types, and applications.
Financial Overview:
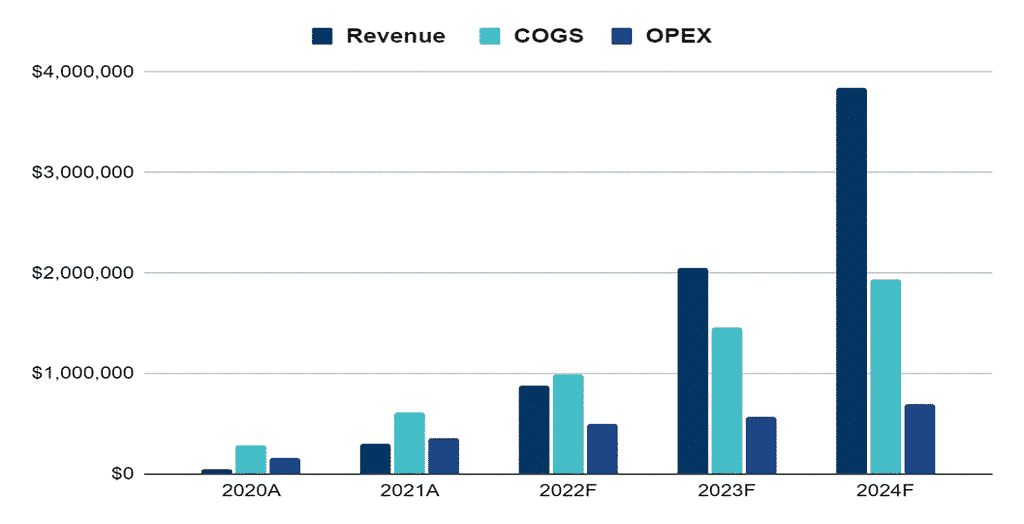
Financial Highlights:
| Liquidity | 2020A | 2021A | 2022F | 2023F | 2024F |
| Current ratio | 6 | 12 | 23 | 32 | 42 |
| Quick ratio | 6 | 11 | 22 | 31 | 40 |
| DSO | 8 | 8 | 8 | 8 | 8 |
| Solvency | |||||
| Interest coverage ratio | 8.2 | 11.1 | 14.2 | ||
| Debt to asset ratio | 0.01 | 0.01 | 0.2 | 0.18 | 0.16 |
| Profitability | |||||
| Gross profit margin | 51% | 51% | 53% | 53% | 53% |
| EBITDA margin | 12% | 14% | 21% | 22% | 22% |
| Return on asset | 5% | 6% | 13% | 14% | 14% |
| Return on equity | 5% | 6% | 16% | 17% | 17% |
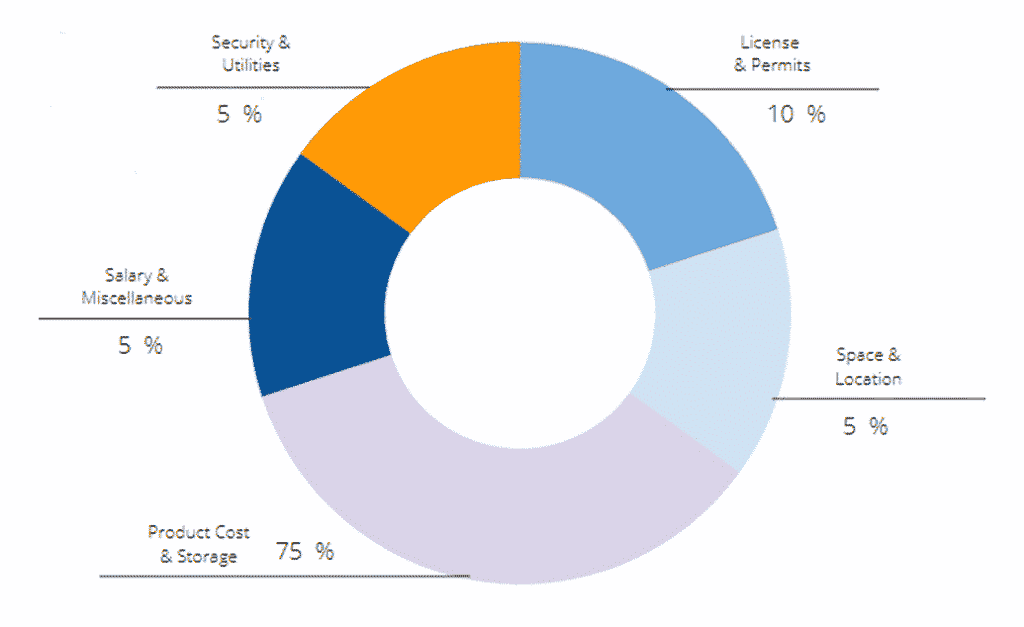
Use of Funds:
Industry Analysis
The trampoline market is worth $2.86 billion from 2020 to 2027, overall revenue is predicted to expand at a CAGR of 4.62 percent, reaching about US$ 3.92 billion. The market is divided into Round, Rectangular, Square, Spring Free, and Rebounder categories based on product type. In 2020, the round-type trampoline had the biggest market share, accounting for 39.42% of the total market. At a CAGR of 5.13 percent, this market is predicted to reach $1.37 billion by the end of the projection period. The reduced jump height of round trampolines is a wonderful safety feature. A product with a round shape is less expensive than one with a different shape. The rectangular type category accounted for 30.4 percent of the market share in 2020 and is predicted to increase at a CAGR of 4.53 percent over the forecast period. Trampolines with a rectangular design have a higher bounce and allow all jumps to rebound equally. The Rebounder Trampoline is a type of tiny trampoline that is close to the ground, making it more solid and secure. They have a greater weight capacity than other items.

The market is divided into Residential and Commercial segments based on end-use. In 2020, the Commercial sector had the biggest market share of 68.72 percent, and it is predicted to increase at a CAGR of 5.9% over the forecast period. Consumers throughout the world are predicted to see the fastest growth in the commercial category among the end-use segments, because to the growing popularity of the Olympic Games and rising disposable income. Due to high demand for trampolines in schools, gyms, playgrounds, and other settings, this segment is projected to remain the most popular.
During the projected period, the residential category is expected to increase at the fastest rate of 4.7 percent. Growing public awareness of the benefits of trampolines is a major element driving up trampoline demand around the world.

The market is divided into three categories: specialty stores, hypermarkets, and e-commerce. During the projected period, the E-commerce channel segment is expected to grow at the fastest rate of 6.47 percent. E-rise commerce’s is fueled by features such as easy payment, free home delivery, easy product exchange and return, product comparison, and other features. Because the costs associated with market intermediaries are reduced on online buying sites, shopping through e-commerce platforms is cost-effective. Major trampoline manufacturers, including Jump Sports, Plum Products, Upper Bounce, and Spring Free Trampoline, have formed partnerships with various online retail outlets throughout the world in order to expand their customer base and product offerings.
North America had the highest market share in 2020, accounting for 39.4%, and is predicted to increase at a CAGR of 6.28 percent over the forecast period. The market in North America is developing due to an increase in the number of athletes, particularly in countries like Canada and the United States, as well as a growing awareness of the importance of adequate physical activity among the public.
During the projected period, the Asia Pacific region is expected to have the highest CAGR of 6.71 percent. Individuals’ growing health consciousness is resulting in a high adoption of home trampolines in Asia Pacific countries such as India, Japan, South Korea, and China. China dominated the Asia Pacific area in 2020, and the market is predicted to reach US$ 0.671 billion in 2027, with a CAGR of 6.3 percent throughout the forecast period. During the projected period, South America, Europe, and the Middle East and Africa are expected to increase steadily.
The purpose of this study is to give industry stakeholders a detailed insight of the trampoline market. The research analyzes complicated data in simple language and presents the past and current state of the industry, as well as anticipated market size and trends. The analysis examines all areas of the industry, with a focus on significant companies such as market leaders, followers, and newcomers.
The research includes a PORTER, PESTEL analysis as well as the possible influence of microeconomic market determinants. External and internal elements that are expected to have a positive or negative impact on the firm have been examined, providing decision-makers with a clear future vision of the industry.
The studies also assist in comprehending the Trampoline Market’s dynamic and structure by studying market segments and forecasting Trampoline Market size. The research is an investor’s guide because it clearly depicts competitive analysis of key competitors in the Trampoline Market by product, price, financial situation, product portfolio, growth plans, and regional presence.
Marketing Plan
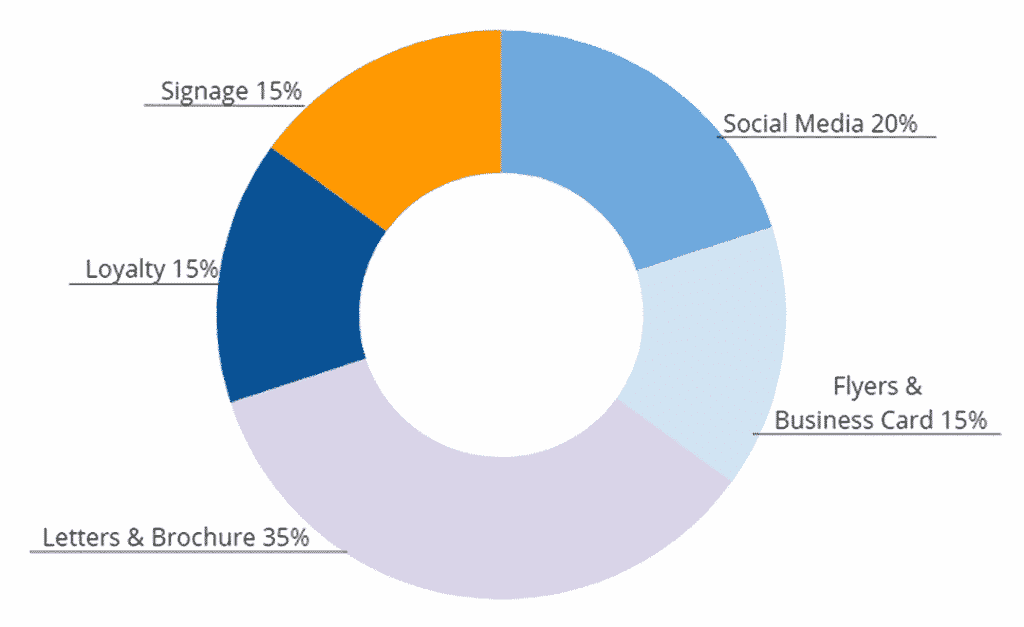
Letters & Brochure: Send introductory letters and a brochure to religious organizations, schools, corporate organizations, homes, and other important stakeholders in Lansing, Michigan, to introduce our outdoor trampoline park facility.
Loyalty: Create a loyalty program that allows us to reward our committed members, particularly those who have registered as a family or group.
Social Media: Use our official website and all accessible social media platforms to promote our outdoor trampoline park.
Flyers & Business Card: Print fliers and business cards and place them in strategic locations such as offices, libraries, public facilities, and railway stations, among others.
Signage: Place our signage/flexi banners in key locations throughout Michigan.
Organizational Plan:
Financial Plan
Earnings:
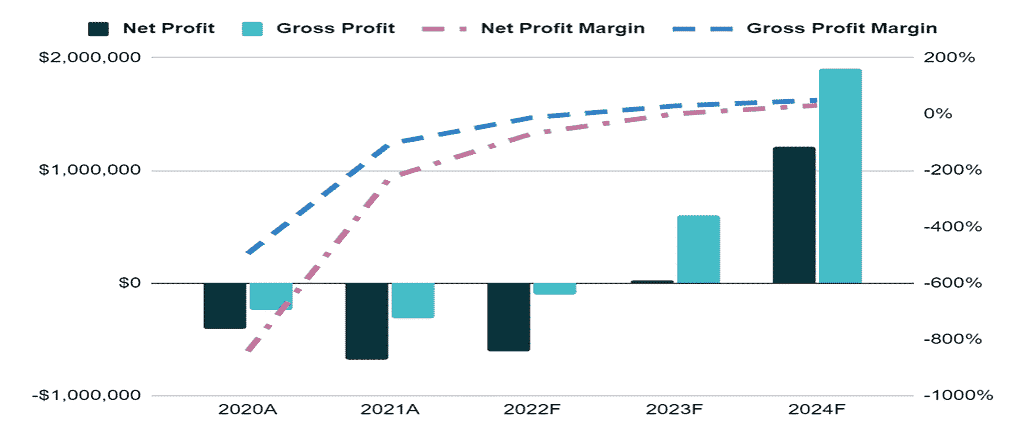
Income Statement:
| 2020A | 2021A | 2022F | 2023F | 2024F | |
| ANNUAL REVENUE | |||||
| Item 1 | 9,217 | 59,117 | 175,410 | 415,277 | 781,357 |
| Item 2 | 34,701 | 222,558 | 660,368 | 1,563,394 | 2,941,580 |
| Item 3 | 4,067 | 19,561 | 46,432 | 78,519 | 114,905 |
| Total annual revenue | 47,985 | 301,236 | 882,211 | 2,057,189 | 3,837,842 |
| % increase | 528% | 193% | 133% | 87% | |
| COST of REVENUE | |||||
| Item 1 | 360 | 2,259 | 6,617 | 15,429 | 28,784 |
| Item 2 | 480 | 3,012 | 8,822 | 20,572 | 38,378 |
| Item 3 | 52,000 | 65,000 | 78,000 | 91,000 | 104,000 |
| Item 4 | 720 | 3,615 | 8,822 | 16,458 | 23,027 |
| Item 5 | 140,000 | 336,000 | 560,000 | 840,000 | 1,120,000 |
| Item 6 | 60,000 | 144,000 | 240,000 | 360,000 | 480,000 |
| Item 7 | 32,000 | 61,333 | 85,533 | 112,153 | 141,435 |
| Total Cost of Revenue | 285,560 | 615,220 | 987,794 | 1,455,612 | 1,935,625 |
| as % of revenue | 595% | 204% | 112% | 71% | 50% |
| Gross Profit | -237,575 | -313,984 | -105,583 | 601,578 | 1,902,218 |
| SELLING & ADMIN EXPENSES | |||||
| Item 1 | 28,000 | 96,800 | 154,880 | 175,692 | 193,261 |
| Item 2 | 75,000 | 105,000 | 120,000 | 120,000 | 120,000 |
| Item 3 | 36,000 | 96,000 | 108,000 | 120,000 | 120,000 |
| Item 4 | 8,000 | 12,000 | 12,000 | 12,000 | 12,000 |
| Item 5 | 3,839 | 18,074 | 44,111 | 61,716 | 115,135 |
| Item 6 | 3,359 | 12,049 | 26,466 | 41,144 | 76,757 |
| Item 7 | 5,600 | 10,000 | 12,904 | 15,034 | 17,376 |
| Item 8 | 6,667 | 14,000 | 22,067 | 30,940 | 40,701 |
| Total selling & admin expenses | 166,464 | 363,924 | 500,428 | 576,525 | 695,230 |
| as % of revenue | 347% | 121% | 57% | 28% | 18% |
| Net profit | -404,039 | -677,907 | -606,011 | 25,052 | 1,206,987 |
| Accumulated net profit | -404,039 | -1,081,947 | -1,687,957 | -1,662,905 | -455,918 |
