Written by Elma Steven | Updated on June, 2024

How to Write a Box Truck Business Plan?
Bowling Alley Business Plan is an outline of your overall business. The business plan includes a 5 year projection, marketing plan, industry analysis, organizational overview, operational overview and finally the executive summary. Remember to write your executive summary at the end as it is considered as a snapshot of the overall business plan. The creation of a business plan requires careful consideration of various factors that might impact the business’s success. Ultimately, a business plan serves as a roadmap to guide the company’s direction.
Executive Summary
Overview: Charles Brown will own Charlie’s Bowling Alley. The company’s primary goal will be to provide bowling alley services to residents of Portland and the surrounding areas. It will offer a wide range of services, from simple bowling lanes to league management, and so on.
Charles earned his MBA two years ago and spent nine months working for a consulting firm before leaving to pursue his childhood ambition of opening a bowling alley. Around him, Charles noted that recreation centers offered expensive, limited offerings. He recognized he could offer a bowling alley business strategy that prioritized family. He also wanted to provide services that were affordable. As a result, he decided to start his own business to put his ideas into action.
Mission: Our goal as a company is to provide courteous, reliable recreational bowling services to our customers.
Vision: To be the go-to bowling alley in Portland and the surrounding areas and to embrace the sport’s changing dynamics.
Industry Overview: As of 2023, the bowling alley industry has shown resilience and adaptability, maintaining steady growth despite facing challenges in recent years. The global market, valued at approximately $10 billion, is buoyed by a renewed interest in recreational and leisure activities. In the United States, where there are over 4,000 bowling centers, the industry has seen a resurgence, particularly among younger demographics who are drawn to bowling as a social and interactive form of entertainment. Innovations such as glow-in-the-dark bowling and the integration of digital technologies for scoring and game enhancements have played a significant role in attracting a diverse range of patrons. Additionally, many bowling alleys have expanded their offerings to include a variety of food and beverage options, further enhancing their appeal as a destination for group outings and family entertainment.
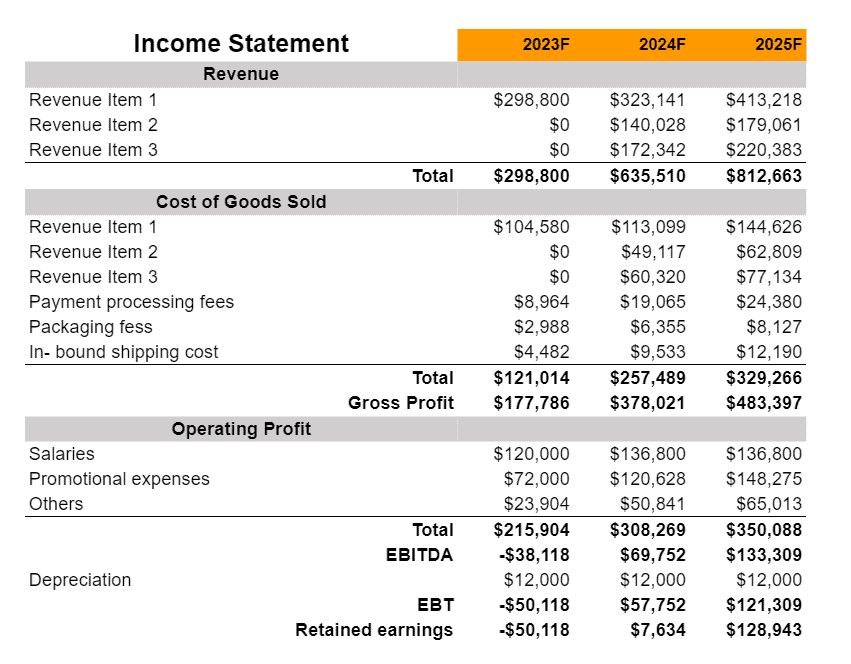
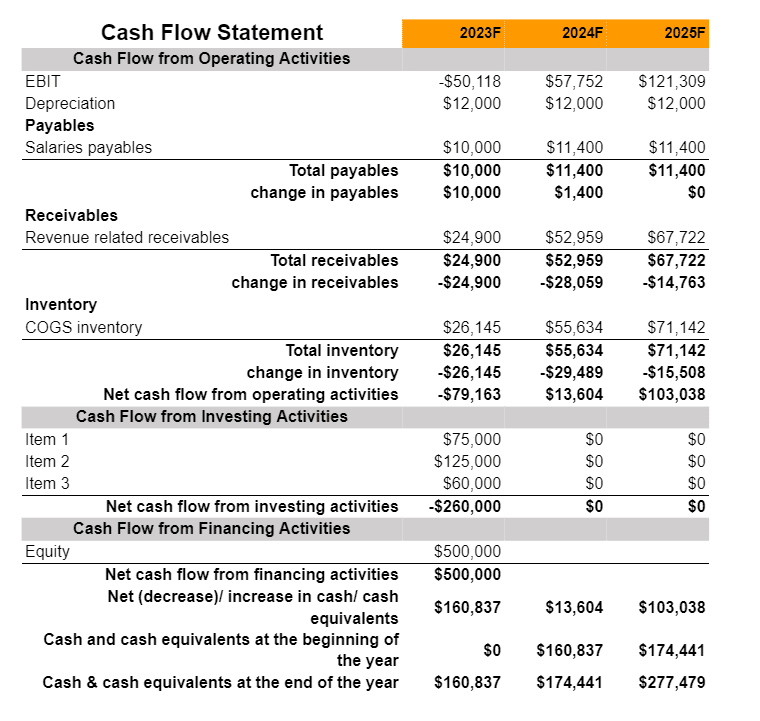
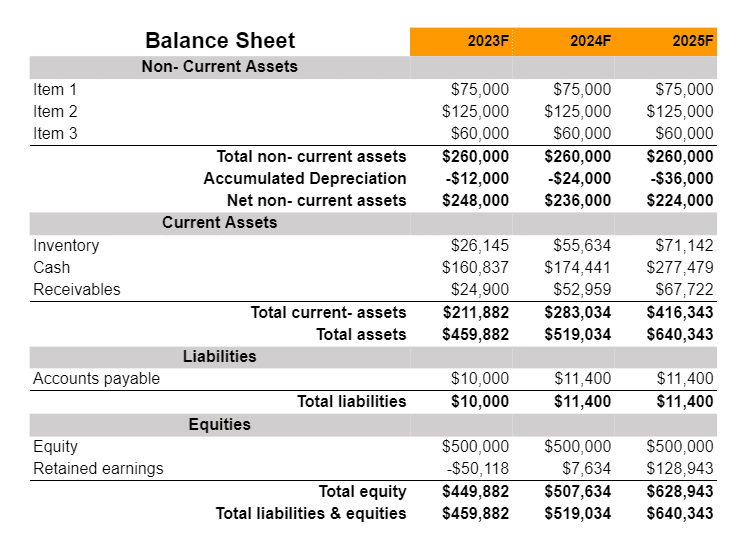
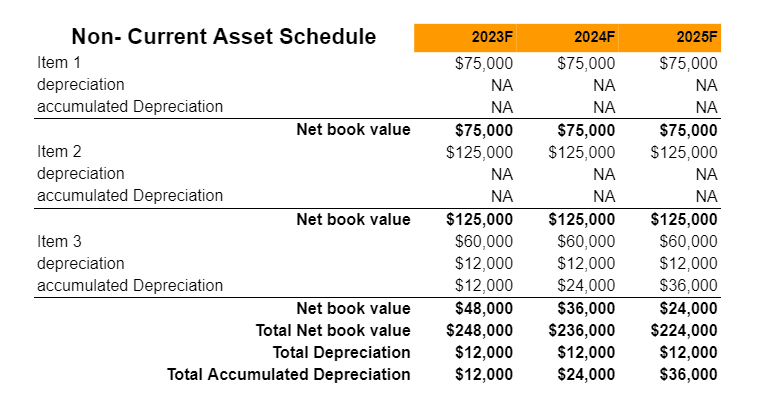
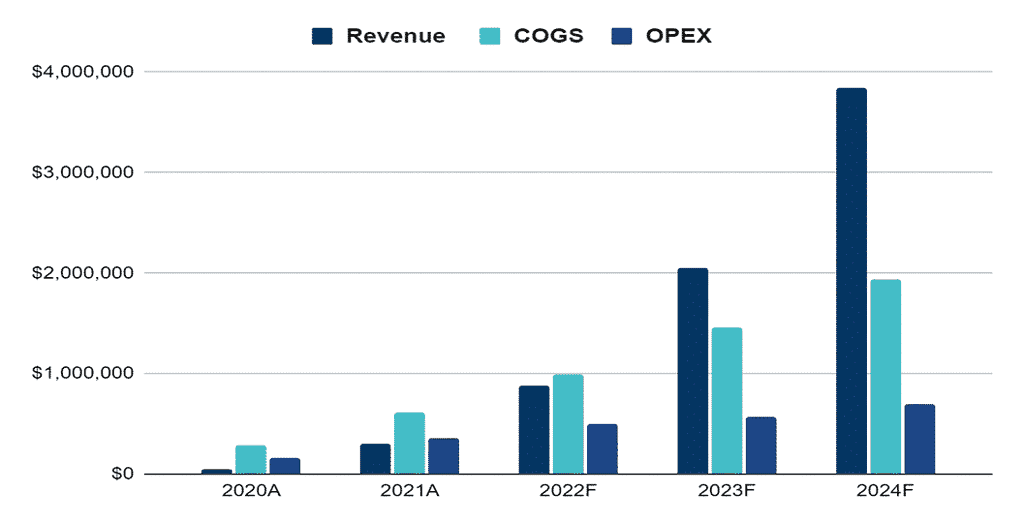
Financial Overview:
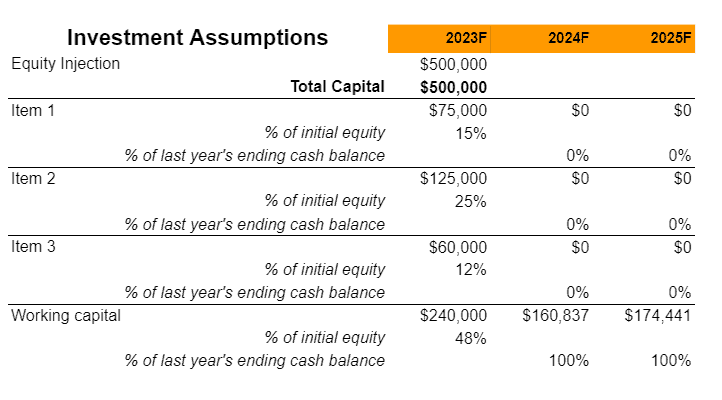
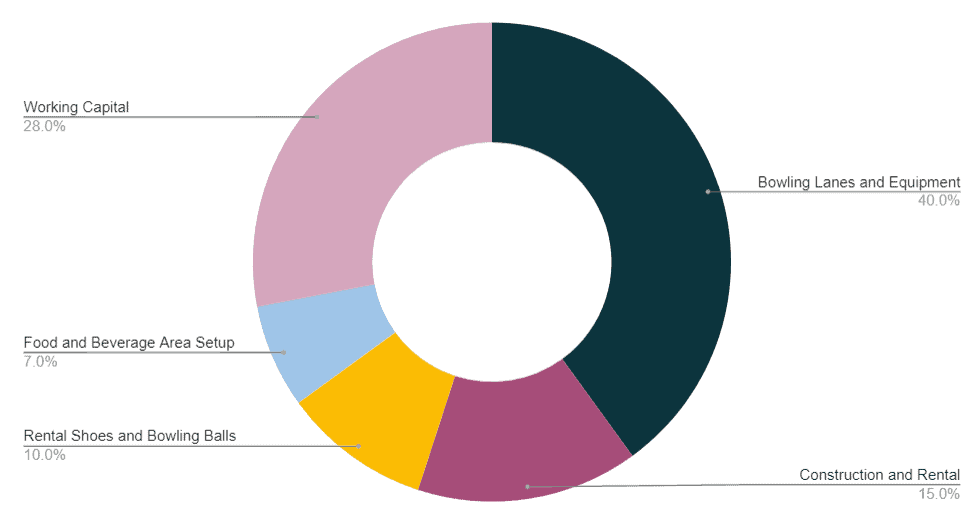
Use of Funds:
Industry Analysis
The global bowling alley market, valued at approximately $10 billion as of 2023, is witnessing a gradual resurgence, especially in the United States where there are over 4,000 active bowling centers. This growth is fueled by an increasing interest in leisure and recreational activities among all age groups, but notably among millennials and Gen Z. These younger demographics are attracted to bowling alleys not just for the sport, but also for the social and entertainment aspects. Bowling has transitioned from a traditional pastime to a modern, social experience, thanks in part to the integration of digital technologies like electronic scoring systems and interactive lane projections, which enhance the overall user experience.
Modern bowling alleys have evolved far beyond their original concept. Many centers now offer a range of services and amenities, including upscale food and beverage options, live music, and themed nights. This diversification has been crucial in attracting a broader customer base. Innovations such as glow-in-the-dark bowling and virtual reality experiences have been instrumental in redefining the bowling experience. Furthermore, the industry is also seeing a trend towards eco-friendliness, with more alleys adopting sustainable practices in their operations, from energy-efficient lighting and machinery to eco-friendly construction materials.
Despite its growth, the industry faces challenges, including high operational costs and the need to continuously upgrade facilities to meet evolving consumer expectations. The competition from other forms of entertainment, such as online gaming and streaming services, also poses a threat. However, the industry’s adaptability and focus on providing a unique, multifaceted experience suggest a positive outlook. Future growth is expected to be driven by further technological integration, an emphasis on customer experience, and strategic marketing efforts aimed at highlighting bowling alleys as versatile entertainment centers suitable for a wide range of occasions, from casual outings to corporate events.

As a result, that is a big factor in the downturn; leagues now account for roughly 20% of the market, and their drop is ongoing. All of the ancient bowling alleys are also contributing to the deterioration. The majority are in bad shape. They fall short of modern expectations in terms of décor, atmosphere, maintenance, guest service/hospitality, and food quality. They are not a place where a more affluent casual bowler would want to go. Most bowling alleys are 20th-century dinosaurs attempting to compete in the 21st-century leisure competitive landscape, and as a result, their numbers are rapidly declining as their customer base has dwindled. However, there is a silver lining to the situation. To attract the American audience, a new style of 21st-century venue featuring bowling has arisen. They’re not called bowling alleys. Bowling is only one of several activities available. They provide more than just bowling; they frequently provide laser tag, bocce ball, and a variety of diversions, including gaming rooms. They provide meals and beverages that satisfy current industry requirements. The décor, ambience, and guest services are all upscale. The most popular ones provide destination dining in a unique restaurant setting. The most popular ones cater to an affluent adult demographic, with no family attractions to dilute their attractiveness. The ones that are well-thought-out generate annual revenues of more than $6.0 million.
The bowling centers market study is divided into two sections: service (bowling and amusement) and geography (food and beverages) (North America, Europe, APAC, South America, and the Middle East and Africa). During the forecast period, North America will be the leading region, accounting for 39 percent of market growth. In North America, the United States and Canada are the most important markets for bowling centers.
Given the huge development potential of the sport, a number of established market participants are focusing on extending their number of bowling lanes and regional presence. Due to the popularity of the family entertainment center idea, bowling centers around the world have begun to draw more customers. This has pushed companies to open new centers in the United States and other desirable places in order to serve a larger target audience. As a result, increased expansion efforts from existing market players will have a substantial impact on the overall size of the bowling centers market in the approaching years.
According to a market survey of bowling facilities, bowling as a sport is becoming more popular in developing economies such as India and South Africa. Bowling fans in emerging nations are flocking to hotel chains with exclusive bowling facilities. This growing interest in bowling in India and South Africa will emerge as one of the most prominent bowling center market trends.
The bowling center market is highly fragmented due to the existence of established and regional companies. Various firms from the hospitality industry are entering the bowling industry, heightening the market’s competition. Customers may be discouraged from attending exclusive bowling facilities if hotels offer specialty bowling centers on their grounds. The increased competition, on the other hand, will drive bowling center vendors to devise efficient tactics in order to stay competitive and maintain their market share.
Marketing Plan

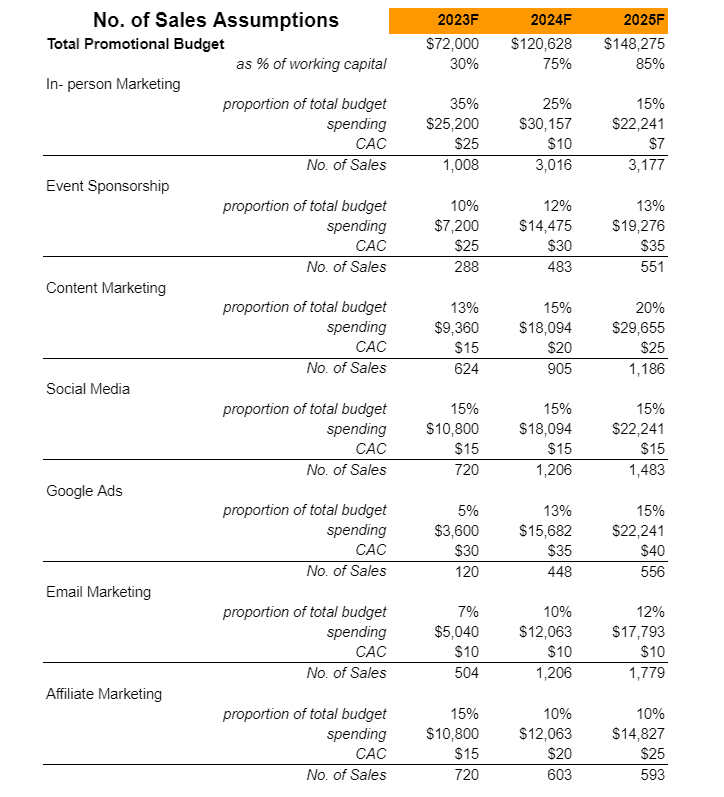
Social Media and Posters: We will advertise our services on social media, on flyers, and by word of mouth.
Discount: We will offer discounts to children as well as customers that book leagues.
Promotions: We will provide discounts and promotions to our consumers on a regular basis.
Email Marketing: To contact with customers and make sales, we use email. We will send cart abandonment emails or run periodic email nurturing campaigns to build long-term relationships and increase long-term revenue.
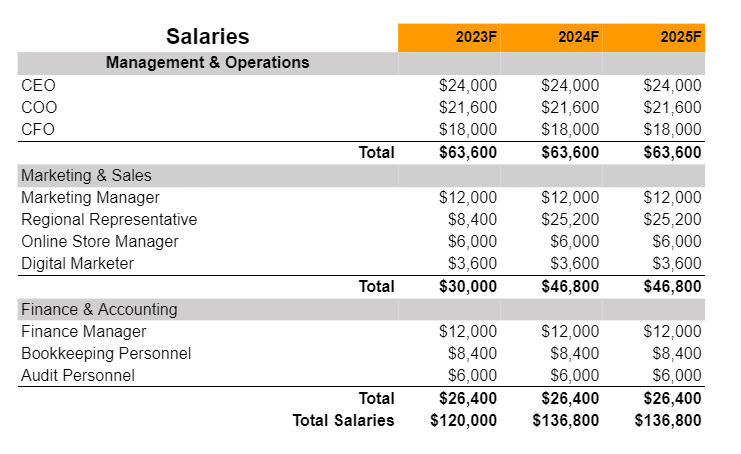
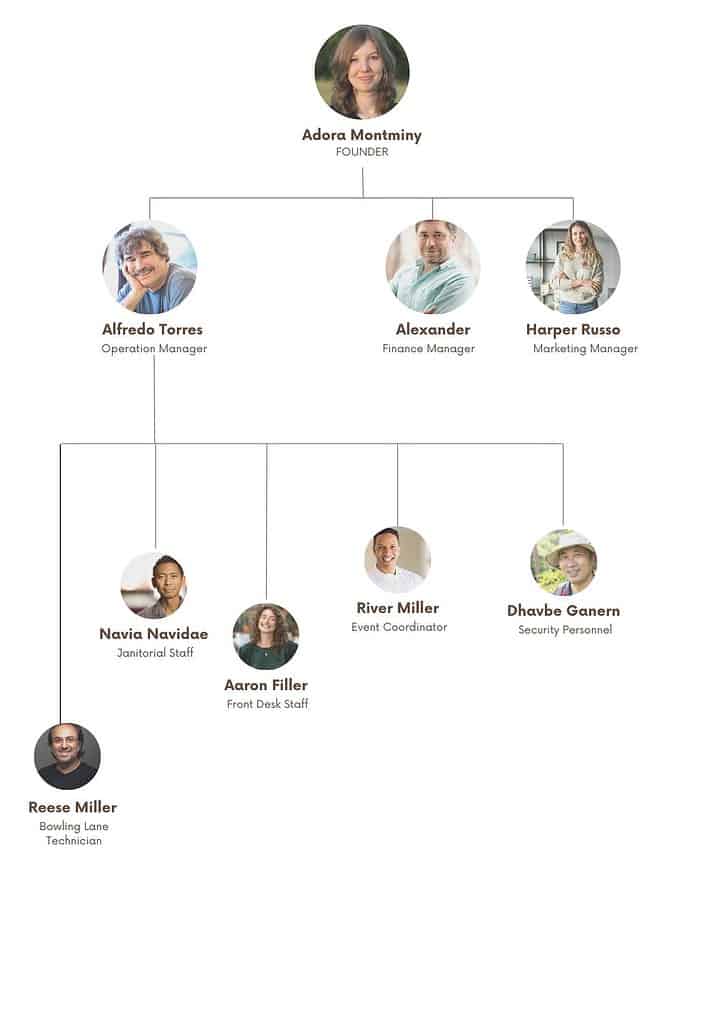
Organogram
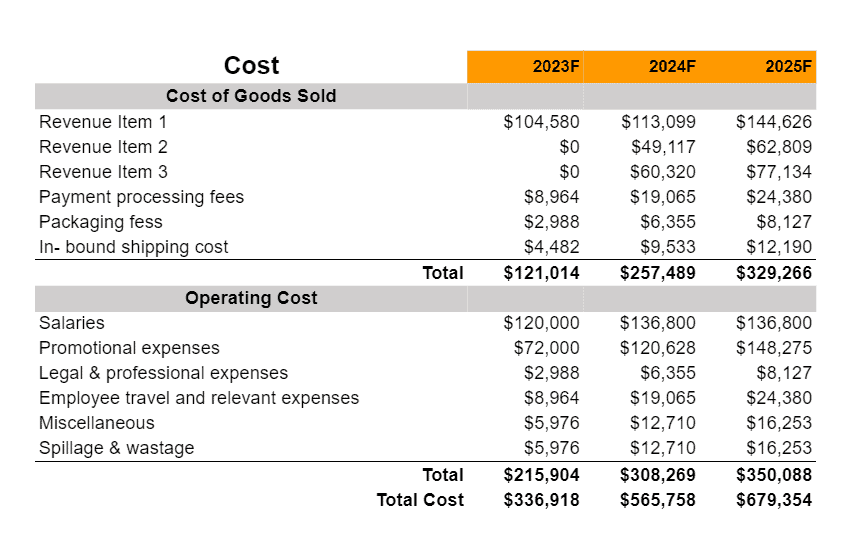
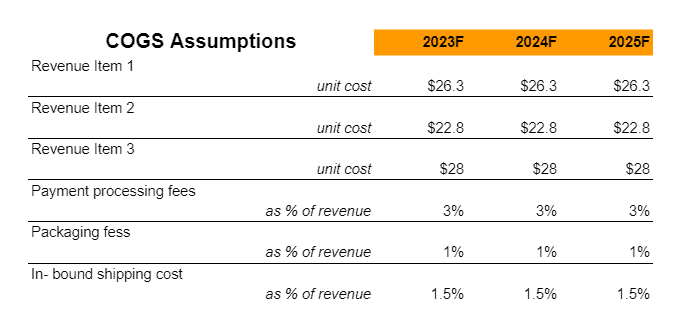
Financial Plan
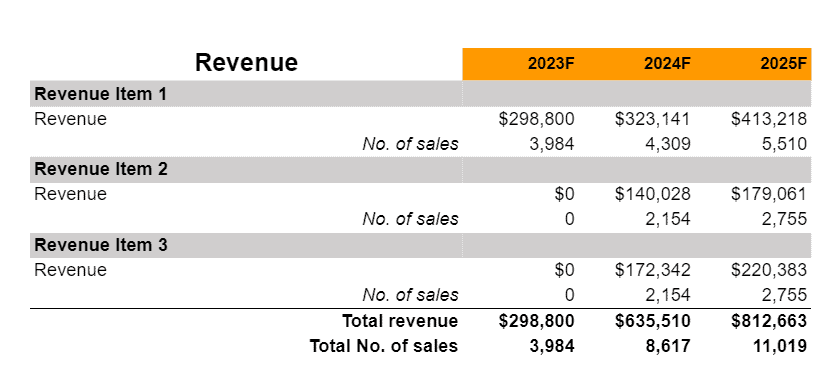
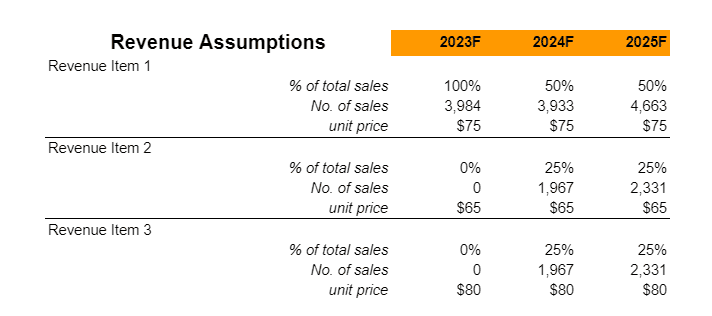
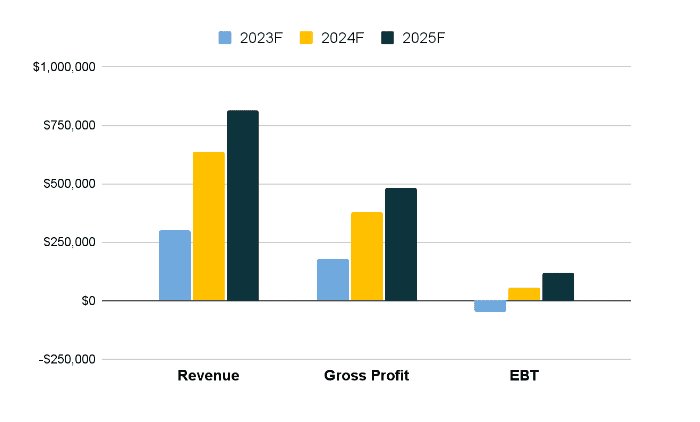
Earnings
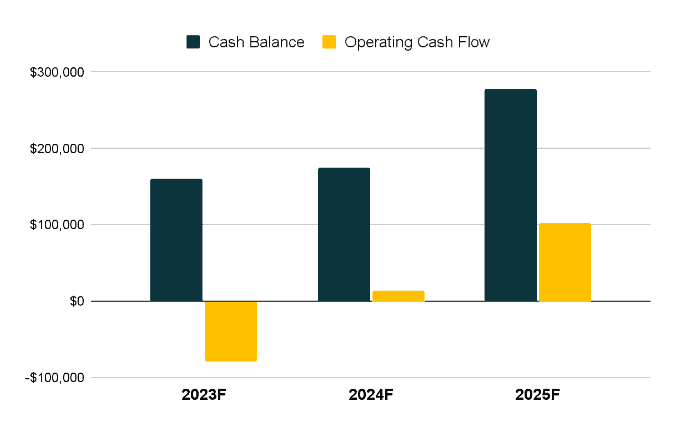
Liquidity
