Written by Elma Steven | Updated on April, 2024

In order to write a Campground Business Plan you need to start with executive summary. In order to write an executive summary for a Business Plan you need to mention- what your business is about and what you’ll sell. Explain how you’ll get people to buy it. The executive summary should be written at the end. Then you should write a Business Description mentioning goals, objectives, mission and vision. Some of the major sections or components of a Plan involves Fund Usage Plan, Marketing Plan, Industry Analysis, Organizational Overview, Operational Overview and Financials.
This article will provide you a step by step process to write your Business Plan. Get a free Business Plan at the end!
Executive Summary
Overview: Unique Arena Campsite, LLC is a well-equipped and conventional campground and recreational complex on the outskirts of Madison, Wisconsin. Our goal in starting the company is to do our part to ensure that families, campers, religious groups, and corporations in Madison and surrounding areas have access to a place that is ideal for family fun and camping. Operating campgrounds, RV parks, overnight recreational camps, travel trailers, caravan campsites, and wilderness camps, as well as other recreational activities, are all part of our offerings.
Mission: “Unique Arena Campground, LLC’s goal is to make a community movement that promotes families and groups to experience camping and other leisure activities in a very safe and pleasurable setting.”
Vision: “With the institution of Unique Arena Campground, LLC, we would like to produce a first bivouac and recreation facility whereas additionally encouraging families and residents of Madison and therefore the close regions to participate in tenting and alternative fun-filled leisure activities.”
Industry Overview:
According to data, there are roughly 14,031 licensed and registered Campgrounds and RV Parks in the United States, employing approximately 51,211 people. The business produces a staggering $6 billion yearly, with an annual growth rate of 2.3 percent expected between 2011 and 2016. It’s vital to note that no one organization controls a significant portion of the market in this area. Over the majority of the five years leading up to 2021, the Campgrounds and RV Parks business has had robust year-over-year growth. Overall, the cost of utilizing campsite and RV facilities is less costly in comparison to other kinds of accommodations, making them particularly attractive to millennials and Generation X. Furthermore, increased disposable income and time spent on leisure and sports have supported substantial sector development during the majority of the era. However, in 2020, during the COVID-19 (coronavirus) pandemic, the business saw significant decreases owing to travel restrictions and stay-at-home orders, despite a short rise in RV sales. Check out this guide on how to write an executive summary? If you don’t have the time to write on then you can use this custom Executive Summary Writer to save Hrs. of your precious time.
Financial Overview:

Financial Highlights:
| Liquidity | 2020A | 2021A | 2022F | 2023F | 2024F |
| Current ratio | 6 | 12 | 23 | 32 | 42 |
| Quick ratio | 6 | 11 | 22 | 31 | 40 |
| DSO | 8 | 8 | 8 | 8 | 8 |
| Solvency | |||||
| Interest coverage ratio | 8.2 | 11.1 | 14.2 | ||
| Debt to asset ratio | 0.01 | 0.01 | 0.2 | 0.18 | 0.16 |
| Profitability | |||||
| Gross profit margin | 51% | 51% | 53% | 53% | 53% |
| EBITDA margin | 12% | 14% | 21% | 22% | 22% |
| Return on asset | 5% | 6% | 13% | 14% | 14% |
| Return on equity | 5% | 6% | 16% | 17% | 17% |
Fund Usage:

Business Model
Tips on Business Model Canvas
The Business Model Canvas is a high-level overview of the business model. It can also be considered as the business model map in the overall plan. The important partners, key activities, value proposition and cost & revenue sections are only some of the nine vital components. A company idea’s complexities may be mapped out, analyzed and communicated with the use of the canvas. It shows the whole picture of a company’s value creation, delivery and capture processes. It helps new business owners hone their ideas, encourage creative thinking and make sound strategic decisions. It’s a helpful resource for coming up with ideas, organizing plans and presenting business models to key players. Check out the 100 samples of business model canvas.

SWOT
Tips on SWOT Analysis
It offers a clear lens into a company’s strengths, weaknesses, opportunities and threats. This self-awareness enables effective resource allocation and strategic positioning against competitors. Businesses can mitigate risks, make informed decisions and set realistic goals. In addition, presenting a SWOT analysis in a business plan communicates to stakeholders that the company possesses a deep understanding of its market environment. In essence, SWOT ensures a business’s strategy is grounded in reality enhancing its chances of success. Check out the 100 SWOT Samples

Industry Analysis:
Overview
Many companies have been impacted by shelter-in-place orders and physical barriers imposed in response to the worldwide COVID-19 outbreak. Here’s how the campground and RV park sector has been affected. When the National Park Service ordered park closures throughout the country during the early stages of the COVID-19 outbreak, campsites and RV parks that depend on national park visitation for income were hit hard. According to the 2020 North American Camping Report by KOA, the decline in outdoor activity is expected to be short-lived as both regular campers and non-campers exhibit interest in camping once restrictions are relaxed. Indeed, many individuals have become more interested in outdoor leisure as a result of the epidemic, leading to an increase in camping and other outdoor activities. In addition, when compared to other forms of lodging, such as hotels, RV camping may be the safest mode of travel. COVID-19 is, in fact, generating a boom in the RV market, with shipments up 54% in July compared to the same month last year. As they get older and become more family and health-conscious, many individuals in the baby boomer age are expected to join leisure clubs or utilize camping and recreation facilities in their areas. Patrons of campers and leisure centers, on the other hand, are expected to switch from pricey all-inclusive clubs to less expensive campgrounds and recreation centers. The tendency in the campground and RV park sector is that if a facility is well-equipped and located near a residential area or a location where people can easily reach without much stress, it will likely attract a large number of visitors.


Source: extension.wisc
Market Segmentation:
IBISWorld projects that the sector will generate $8.7 billion in sales in 2020, with persons aged 34 and under accounting for 41%, 35 to 54 years for 36%, and 55 years and above for 37%. (23 percent ). People aged 34 and under have expanded their engagement in outdoor activities, accounting for the majority of campsite and RV park earnings. The segment’s rise over the last five years has been aided by free Wi-Fi and music festivals with camping. People between the ages of 35 and 54 have often hit their peak earning potential, resulting in greater disposable cash and extra time for travel. People aged 55 and over presently make up the smallest group, but according to IBISWorld, they will become the industry’s fastest expanding section. Almost 10%

Source: crrhospitality
Marketing Plan:

Website and Social Media: Use the internet and social media platforms to promote our brand, such as Instagram, Facebook, Twitter, YouTube, Google+, and so on. Include Unique Arena Campground, LLC in local phone books and directories.
Promote our campsite on our official website and use traffic-drawing methods.
Seminar and Programs: Sponsor sports events and tournaments in your town that are meaningful to you.
Referral Marketing: Distribute our flyers and handbills at strategic locations.
Advertisement: Install our billboards in high-traffic areas in Madison, Wisconsin. From time to time, hold a road concert in a certain area. Ensure that all of our employees are wearing our branded clothing and that all of our official cars and trucks are well-branded with our company emblem and other identifying information.
Pre-Opening Events: Distribute our flyers and handbills at strategic locations. Calling families, businesses, religious groups, and schools to educate them about Unique Arena Campground, LLC and the amenities and services we provide is a good way to start.
Commute Advertising: By employing individuals to display signs alongside we will draw attention to Unique Arena Campground, LLC
Customer Loyalty Program: To honor our loyal consumers, we will develop customer incentive programs and promotions.
Organogram:

Financial Plan:
Earnings:

Break-Even Analysis :

Income Statement:
| 2020A | 2021A | 2022F | 2023F | 2024F | |
| ANNUAL REVENUE | |||||
| Item 1 | 9,217 | 59,117 | 175,410 | 415,277 | 781,357 |
| Item 2 | 34,701 | 222,558 | 660,368 | 1,563,394 | 2,941,580 |
| Item 3 | 4,067 | 19,561 | 46,432 | 78,519 | 114,905 |
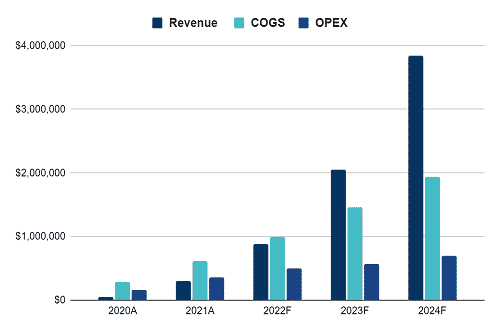
| Total annual revenue | 47,985 | 301,236 | 882,211 | 2,057,189 | 3,837,842 |
| % increase | 528% | 193% | 133% | 87% | |
| COST of REVENUE | |||||
| Item 1 | 360 | 2,259 | 6,617 | 15,429 | 28,784 |
| Item 2 | 480 | 3,012 | 8,822 | 20,572 | 38,378 |
| Item 3 | 52,000 | 65,000 | 78,000 | 91,000 | 104,000 |
| Item 4 | 720 | 3,615 | 8,822 | 16,458 | 23,027 |
| Item 5 | 140,000 | 336,000 | 560,000 | 840,000 | 1,120,000 |
| Item 6 | 60,000 | 144,000 | 240,000 | 360,000 | 480,000 |
| Item 7 | 32,000 | 61,333 | 85,533 | 112,153 | 141,435 |
| Total Cost of Revenue | 285,560 | 615,220 | 987,794 | 1,455,612 | 1,935,625 |
| as % of revenue | 595% | 204% | 112% | 71% | 50% |
| Gross Profit | -237,575 | -313,984 | -105,583 | 601,578 | 1,902,218 |
| SELLING & ADMIN EXPENSES | |||||
| Item 1 | 28,000 | 96,800 | 154,880 | 175,692 | 193,261 |
| Item 2 | 75,000 | 105,000 | 120,000 | 120,000 | 120,000 |
| Item 3 | 36,000 | 96,000 | 108,000 | 120,000 | 120,000 |
| Item 4 | 8,000 | 12,000 | 12,000 | 12,000 | 12,000 |
| Item 5 | 3,839 | 18,074 | 44,111 | 61,716 | 115,135 |
| Item 6 | 3,359 | 12,049 | 26,466 | 41,144 | 76,757 |
| Item 7 | 5,600 | 10,000 | 12,904 | 15,034 | 17,376 |
| Item 8 | 6,667 | 14,000 | 22,067 | 30,940 | 40,701 |
| Total selling & admin expenses | 166,464 | 363,924 | 500,428 | 576,525 | 695,230 |
| as % of revenue | 347% | 121% | 57% | 28% | 18% |
| Net profit | -404,039 | -677,907 | -606,011 | 25,052 | 1,206,987 |
| Accumulated net profit | -404,039 | -1,081,947 | -1,687,957 | -1,662,905 | -455,918 |
Cash Flow Statement:
| 2020A | 2021A | 2022F | 2023F | 2024F | |
| CASH FLOW from OPERATING ACTIVITIES | |||||
| Net profit before tax | -$404,039 | -$677,907 | -$606,011 | $25,052 | $1,206,987 |
| Depreciation | $44,267 | $85,333 | $120,504 | $158,127 | $199,512 |
| Payables | |||||
| Item 1 | $4,333 | $5,417 | $6,500 | $7,583 | $8,667 |
| Item 2 | $11,667 | $28,000 | $46,667 | $70,000 | $93,333 |
| Item 3 | $6,250 | $8,750 | $10,000 | $10,000 | $10,000 |
| Item 4 | $3,000 | $8,000 | $9,000 | $10,000 | $10,000 |
| Item 5 | $667 | $1,000 | $1,000 | $1,000 | $1,000 |
| Total payables | $25,917 | $51,167 | $73,167 | $98,583 | $123,000 |
| change in payables | $25,917 | $25,250 | $22,000 | $25,417 | $24,417 |
| Receivables | |||||
| Item 1 | $320 | $1,506 | $3,676 | $5,143 | $9,595 |
| Item 2 | $360 | $1,807 | $4,411 | $8,229 | $11,514 |
| Total receivables | $680 | $3,314 | $8,087 | $13,372 | $21,108 |
| change in receivables | -$680 | -$2,634 | -$4,773 | -$5,285 | -$7,736 |
| Net cash flow from operating activities | -$334,536 | -$569,958 | -$468,280 | $203,311 | $1,423,180 |
| CASH FLOW from INVESTING ACTIVITIES | |||||
| Item 1 | $16,000 | $13,200 | $14,520 | $15,972 | $17,569 |
| Item 2 | $20,000 | $22,000 | $24,200 | $26,620 | $29,282 |
| Item 3 | $28,000 | $22,000 | $14,520 | $10,648 | $11,713 |
| Item 4 | $96,000 | $88,000 | $72,600 | $79,860 | $87,846 |
| Item 5 | $20,000 | $22,000 | $24,200 | $26,620 | $29,282 |
| Net cash flow/ (outflow) from investing activities | -$180,000 | -$167,200 | -$150,040 | -$159,720 | -$175,692 |
| CASH FLOW from FINANCING ACTIVITIES | |||||
| Equity | $400,000 | $440,000 | $484,000 | $532,400 | $585,640 |
| Net cash flow from financing activities | $400,000 | $440,000 | $484,000 | $532,400 | $585,640 |
| Net (decrease)/ increase in cash/ cash equivalents | -$114,536 | -$297,158 | -$134,320 | $575,991 | $1,833,128 |
| Cash and cash equivalents at the beginning of the year | – | -$114,536 | -$411,693 | -$546,014 | $29,978 |
| Cash & cash equivalents at the end of the year | -$114,536 | -$411,693 | -$546,014 | $29,978 | $1,863,105 |
Balance Sheet:
| 2020A | 2021A | 2022F | 2023F | 2024F | |
| NON-CURRENT ASSETS | |||||
| Item 1 | $16,000 | $29,200 | $43,720 | $59,692 | $77,261 |
| Item 2 | $20,000 | $42,000 | $66,200 | $92,820 | $122,102 |
| Item 3 | $28,000 | $50,000 | $64,520 | $75,168 | $86,881 |
| Item 4 | $96,000 | $184,000 | $256,600 | $336,460 | $424,306 |
| Item 5 | $20,000 | $42,000 | $66,200 | $92,820 | $122,102 |
| Total | $180,000 | $347,200 | $497,240 | $656,960 | $832,652 |
| Accumulated depreciation | $44,267 | $129,600 | $250,104 | $408,231 | $607,743 |
| Net non-current assets | $135,733 | $217,600 | $247,136 | $248,729 | $224,909 |
| CURRENT ASSETS | |||||
| Cash | -$114,536 | -$411,693 | -$546,014 | $29,978 | $1,863,105 |
| Accounts receivables | $680 | $3,314 | $8,087 | $13,372 | $21,108 |
| Total current assets | -$113,856 | -$408,380 | -$537,927 | $43,349 | $1,884,214 |
| Total Assets | $21,878 | -$190,780 | -$290,791 | $292,078 | $2,109,122 |
| LIABILITIES | |||||
| Account payables | $25,917 | $51,167 | $73,167 | $98,583 | $123,000 |
| Total liabilities | $25,917 | $51,167 | $73,167 | $98,583 | $123,000 |
| EQUITIES | |||||
| Owner’s equity | $400,000 | $840,000 | $1,324,000 | $1,856,400 | $2,442,040 |
| Accumulated net profit | -$404,039 | -$1,081,947 | -$1,687,957 | -$1,662,905 | -$455,918 |
| Total equities | -$4,039 | -$241,947 | -$363,957 | $193,495 | $1,986,122 |
| Total liabilities & equities | $21,878 | -$190,780 | -$290,791 | $292,078 | $2,109,122 |

