Written by Elma Steven | Updated on August, 2024
In order to write a Catfish Farm Business Plan you need to start with executive summary. In order to write an executive summary for a Catfish Farm Business Plan you need to mention- what your business is about and what you’ll sell. Explain how you’ll get people to buy it. The executive summary should be written at the end. Then you should write a Business Description mentioning goals, objectives, mission and vision. Some of the major sections or components of a Catfish Farm Business Plan involves Fund Usage Plan, Marketing Plan, Industry Analysis, Organizational Overview, Operational Overview and Financials.
This article will provide you a step by step process to write your Business Plan. Get a freeCatfish Farm Business Plan at the end!
Table of Contents
Executive Summary
Overview: Fishy Bites LLC is a catfish farming and processing company that aims to provide high-quality, fresh and healthy catfish products to consumers. Our business is founded on the belief that the demand for catfish in the United States is on the rise, but the supply is limited. We aim to bridge this gap by producing and processing catfish in a sustainable, ethical, and environmentally-friendly way.
Problem Summary: The catfish industry in the United States is facing several challenges. Firstly, there is a limited supply of catfish in the market. Secondly, the catfish industry has been affected by increased competition from imported catfish, which is often of lower quality and produced in conditions that are not up to the standards expected by American consumers. Lastly, consumers are increasingly concerned about the ethical and environmental impact of the food they eat, which has led to a growing demand for sustainably produced and ethically sourced catfish.
Solution Summary: Fishy Bites LLC aims to address the challenges facing the catfish industry by producing and processing high-quality catfish products that meet the expectations of American consumers. We plan to achieve this by implementing sustainable and environmentally-friendly farming practices, which will enable us to produce catfish that is healthy, fresh, and of high quality. We will also focus on developing strong relationships with our customers and ensuring that our products are marketed effectively, with a strong emphasis on our commitment to ethical and sustainable production methods.
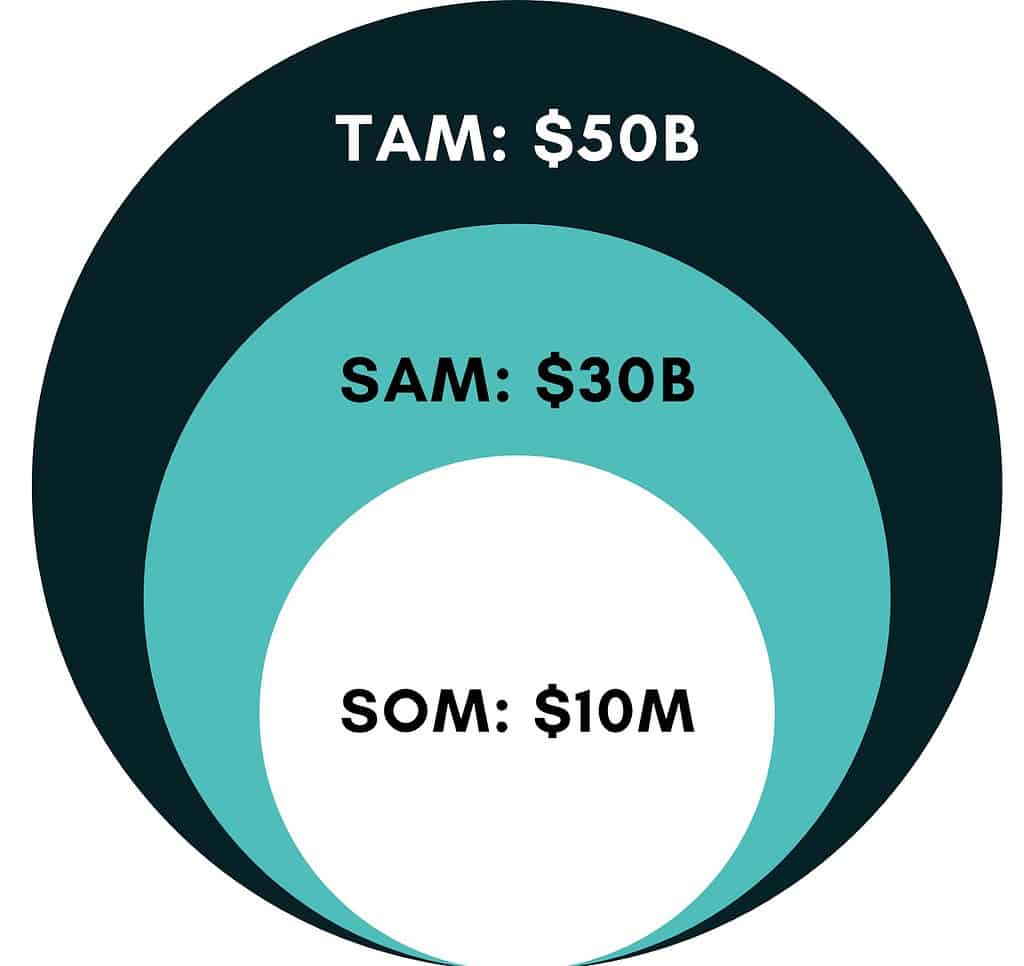
Industry Overview: The catfish industry in the United States is worth an estimated $414 million (IOP), and it has been growing steadily over the past decade. However, the industry is facing several challenges, including increased competition from imported catfish, which accounts for approximately 70% (Mississippi State University) of the catfish sold in the United States. This imported catfish is often of lower quality than domestically produced catfish, and it is often produced in conditions that are not up to the standards expected by American consumers.
In addition to competition from imported catfish, the catfish industry is also facing challenges related to sustainability and ethical production methods. Consumers are increasingly concerned about the environmental impact of the food they eat, and they are demanding products that are produced in a sustainable and ethical way. This has led to a growing interest in locally produced catfish, which is often seen as a more sustainable and ethical alternative to imported catfish (Research Gate).
Despite these challenges, there is a growing demand for high-quality catfish products in the United States, and Fishy Bites LLC aims to capitalize on this demand by producing and processing catfish in a sustainable and ethical way that meets the expectations of American consumers.
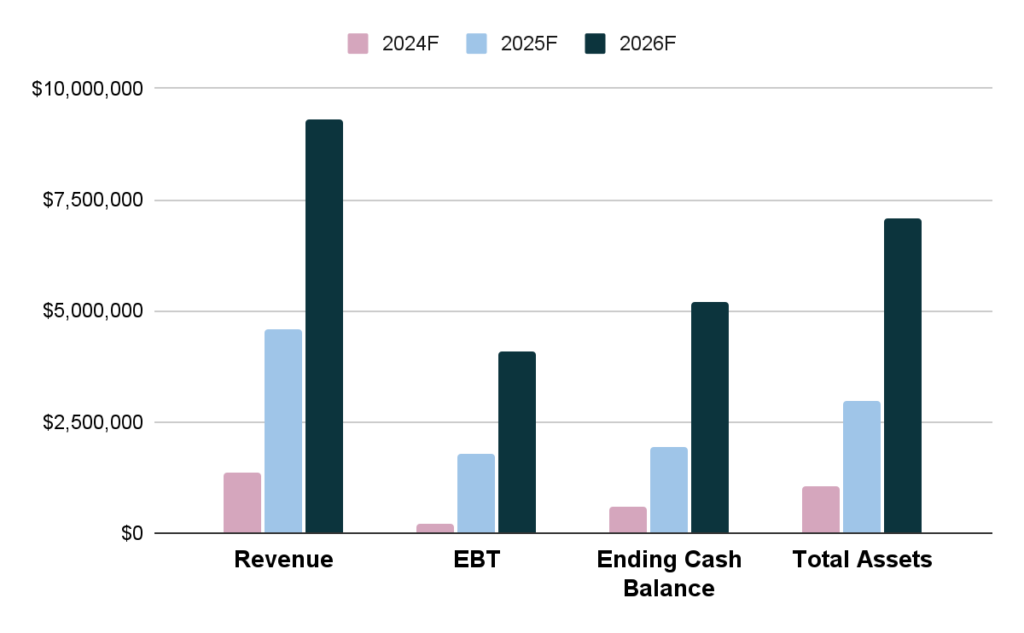
Financial Forecast:
Check out this guide on how to write an executive summary? If you don’t have the time to write on then you can use this custom Executive Summary Writer to save Hrs. of your precious time.
Business Description
Business Name: Fishy Bites LLC
Founder: Jacob Harrison
Management Team:
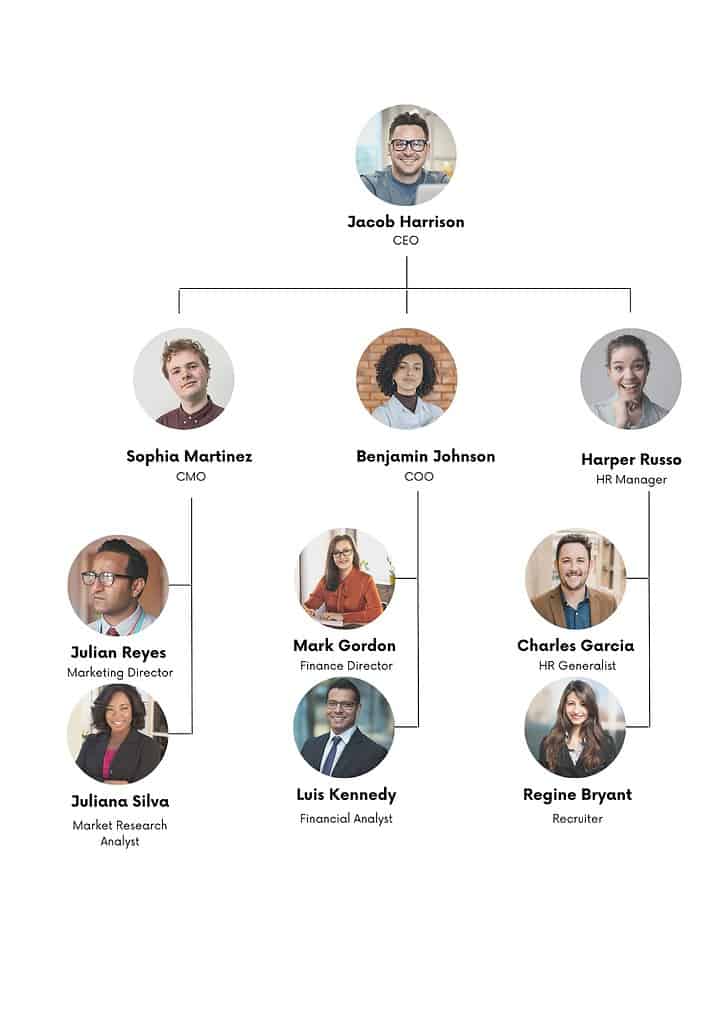
| Name | Designation |
| Jacob Harrison | Chief Executive Officer |
| Sophia Martinez | Chief Marketing Officer |
| Benjamin Johnson | Chief Financial Officer |
Legal Structure: LLC
Location: 1234 Main St, Bellevue, WA 98004
Mission: “Fishy Bites LLC aims to produce and process high-quality catfish products in a sustainable, ethical, and environmentally-friendly way, while ensuring that our customers receive exceptional service and satisfaction.”
Vision: “Our vision is to become the leading provider of sustainably produced catfish products in the United States, by utilizing cutting-edge technology and sustainable practices to ensure the highest quality products for our customers.”
Goals:
- To produce and process high-quality catfish products that meet the expectations of American consumers.
- To implement sustainable and environmentally-friendly farming practices, which will enable us to produce catfish that is healthy, fresh, and of high quality.
- To develop strong relationships with our customers and ensure that our products are marketed effectively, with a strong emphasis on our commitment to ethical and sustainable production methods.
- To expand our product line to include a variety of catfish products, such as fillets, nuggets, and value-added products, to meet the changing demands of our customers.
Products:
Fishy Bites LLC offers a variety of high-quality catfish products, including fresh and frozen whole catfish, fillets, nuggets, and value-added products such as seasoned and breaded catfish. Our products are sustainably produced and processed in our state-of-the-art facility, ensuring the highest quality and freshness for our customers. We also offer custom packaging options to meet the specific needs of our customers.
Financial Overview
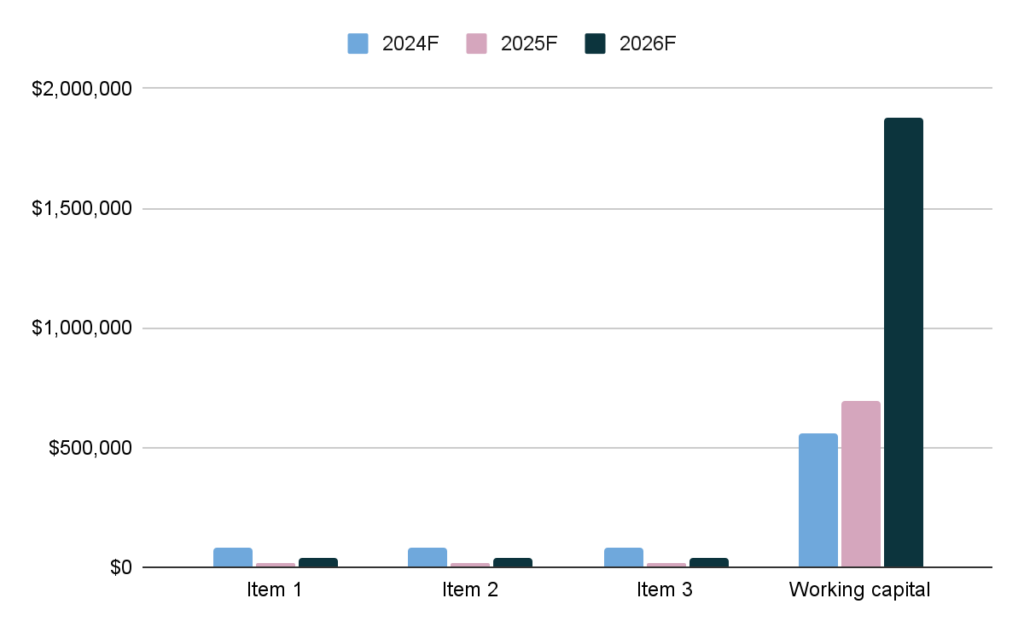
Fund Usage Plan
Key Metrics:
| All monetary figures are in USD | 2024F | 2025F | 2026F |
| Earnings | |||
| Revenue | $1,368,416 | $4,594,157 | $9,302,745 |
| Gross Profit | $814,024 | $2,732,745 | $5,533,557 |
| Gross Margin | 59% | 59% | 59% |
| EBT | $206,551 | $1,773,057 | $4,077,613 |
| EBT Margin | 15% | 39% | 44% |
| Liquidity | |||
| Current Ratio | 25 | 84 | 209 |
| Quick Ratio | 22 | 72 | 184 |
Business Model Canvas
Tips on Business Model Canvas
The Business Model Canvas is a high-level overview of the business model. It can also be considered as the business model map in the overall plan. The important partners, key activities, value proposition and cost & revenue sections are only some of the nine vital components. A company idea’s complexities may be mapped out, analyzed and communicated with the use of the canvas. It shows the whole picture of a company’s value creation, delivery and capture processes. It helps new business owners hone their ideas, encourage creative thinking and make sound strategic decisions. It’s a helpful resource for coming up with ideas, organizing plans and presenting business models to key players. Check out the 100 samples of business model canvas.

SWOT
Tips on SWOT Analysis
It offers a clear lens into a company’s strengths, weaknesses, opportunities and threats. This self-awareness enables effective resource allocation and strategic positioning against competitors. Businesses can mitigate risks, make informed decisions and set realistic goals. In addition, presenting a SWOT analysis in a business plan communicates to stakeholders that the company possesses a deep understanding of its market environment. In essence, SWOT ensures a business’s strategy is grounded in reality enhancing its chances of success. Check out the 100 SWOT Samples

Organizational Overview
Founder

Jacob Harrison
Founder/ CEO/ Jacob Harrison
Hi there! My name is Jacob Harrison and I am the founder of Fishy Bites LLC, a sustainable catfish farming and processing company based in the United States. I have a strong passion for sustainable food production and a deep understanding of the importance of ethical and environmentally-friendly farming practices.
Prior to starting Fishy Bites LLC, I worked as a sustainable food consultant, advising businesses on how to implement sustainable and environmentally-friendly practices in their operations. I also have experience in the food industry, having worked as a chef and food service provider.
I hold a degree in Environmental Science from a top university in the United States, where I focused on sustainable food systems and environmental policies. I have also completed training programs in sustainable farming practices and food safety.
In starting Fishy Bites LLC, I am committed to creating a positive impact on the food industry, by producing high-quality, sustainably-produced catfish products that meet the expectations of American consumers. I am dedicated to building strong relationships with customers and partners, and ensuring that Fishy Bites LLC operates with the highest levels of integrity and commitment to sustainability.
Organogram
Salaries
| All monetary figures are in USD | 2024F | 2025F | 2026F |
| Manager | $30,000 | $30,000 | $30,000 |
| Salesperson | $30,000 | $30,000 | $30,000 |
| Customer service representative | $30,000 | $30,000 | $30,000 |
| Accountant/Bookkeeper | $30,000 | $30,000 | $30,000 |
| Marketing Specialist | $30,000 | $30,000 | $30,000 |
| Operations Specialist | $30,000 | $30,000 | $30,000 |
| IT specialist/Computer technician | $30,000 | $30,000 | $30,000 |
| Human resources specialist | $30,000 | $30,000 | $30,000 |
| Production worker/Assembler | $30,000 | $30,000 | $30,000 |
| Delivery driver/Logistics Specialist | $30,000 | $30,000 | $30,000 |
| Graphic designer/Visual artist | $30,000 | $30,000 | $30,000 |
| Content writer/Blogger | $30,000 | $30,000 | $30,000 |
| Social media specialist | $30,000 | $30,000 | $30,000 |
| Total | $390,000 | $390,000 | $390,000 |
Industry Analysis
Industry Problems
- Unsustainable and unethical farming practices in the catfish industry can negatively impact the environment and animal welfare.
- Lack of transparency in the catfish industry regarding sourcing, processing, and labeling can lead to confusion and mistrust among consumers.
- Competition from foreign catfish producers can pose a threat to domestic catfish producers, as imported catfish may be cheaper and of lower quality.
- Consumers may not be aware of the nutritional benefits of catfish and may perceive it as an inferior seafood option compared to other fish species.
Industry Opportunities
- Growing demand for sustainably-produced and ethically-sourced food products presents an opportunity for catfish producers to differentiate themselves from competitors.
- Increasing interest in local and regional food production can provide opportunities for small-scale catfish farmers and processors.
- Collaboration with other sustainable food producers can help to promote catfish products as part of a wider range of sustainable food options.
Market Segmentation
- Demographic Segmentation:
- Age: Consumers of all ages may be interested in catfish products, but there may be a higher demand among older consumers who are more likely to prioritize sustainably-produced and ethically-sourced food.
- Gender: Catfish products may appeal to both male and female consumers.
- Income: Consumers of all income levels may be interested in catfish products, but higher-income consumers may be willing to pay a premium for sustainably-produced and ethically-sourced options.
- Location: Consumers located in regions with a strong tradition of catfish consumption, such as the Southern United States, may be more likely to purchase catfish products.
- Psychographic Segmentation:
- Values: Consumers who prioritize sustainability, environmental responsibility, and ethical food production may be more likely to purchase catfish products from sustainable and ethical producers.
- Lifestyles: Consumers who lead active, healthy lifestyles may be more likely to purchase catfish products due to its nutritional benefits.
- Attitudes: Consumers who are open to trying new food products and exploring sustainable food options may be more likely to purchase catfish products.
- Behavioral Segmentation:
- Occasions: Consumers may be more likely to purchase catfish products for special occasions such as holidays or events.
- Benefits: Consumers may be drawn to the nutritional benefits of catfish, such as its high protein and low-fat content.
- User Status: Consumers who are regular seafood consumers may be more likely to purchase catfish products.
Market Size
Marketing Plan
Marketing Budget
Marketing Objectives
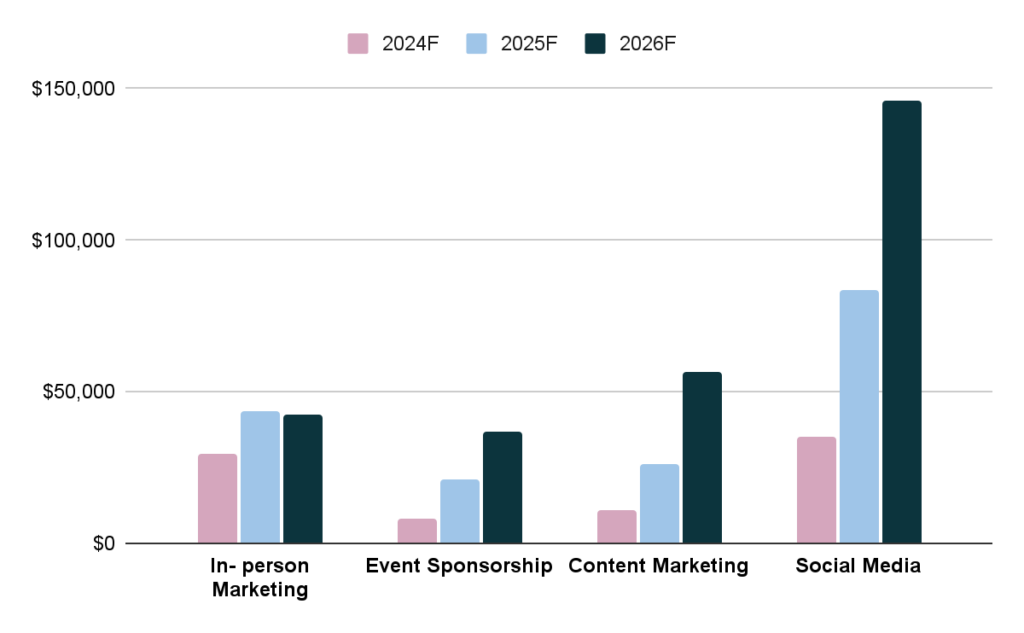
- Boost brand awareness: Increase recognition and recall by 20% within 12 months using targeted campaigns and social media.
- Grow market share: Expand market share by 10% in two years with innovative products and new segments.
- Retain customers: Raise repeat customer rate by 15% within a year through personalization, loyalty programs, and customer support.
- Enhance online presence: Increase website traffic by 25% and social media followers by 30% in 18 months using engaging content and SEO.
- Increase sales revenue: Achieve a 20% revenue growth in the next financial year with promotional strategies and product expansion.
- Strengthen brand loyalty: Improve net promoter score (NPS) by 10 points in 12 months by focusing on customer satisfaction and loyalty benefits.
- Promote sustainability: Increase eco-friendly products by 30% in two years to appeal to environmentally conscious consumers.
- Improve customer engagement: Boost email open rates by 20% and click-through rates by 15% in a year with targeted email campaigns.
- Enter new markets: Launch products in two international markets within 24 months using market research and strategic partnerships.
- Enhance product positioning: Raise top-of-mind awareness as a leader in comfort and innovation within 18 months through marketing and product innovation.
Go-to-Market (GTM) Strategy
- Social Media Marketing:
a. Create and share engaging content that reflects the brand’s values and showcases products.
b. Collaborate with influencers who resonate with your target audience to increase reach and brand awareness.
c. Utilize paid advertising campaigns on platforms like Instagram, Facebook, and Pinterest to target specific customer segments.
d. Engage with followers, respond to comments, and address customer inquiries to strengthen customer relationships and loyalty.
- Content Marketing:
a. Develop a blog on the brand’s website featuring educational and informative content about undergarments, trends, and styling tips.
b. Leverage video content on platforms like YouTube to showcase products, share tutorials, and engage with customers.
c. Create infographics or visually appealing content to share on social media platforms and drive website traffic.
- Email Marketing:
a. Build and segment email lists based on customer behavior, preferences, and demographics.
b. Send personalized email campaigns with targeted offers, promotions, and relevant content.
c. Utilize automation tools to nurture leads and encourage repeat purchases.
- Public Relations:
a. Develop press releases and media kits to promote product launches, collaborations, or brand milestones.
b. Cultivate relationships with industry journalists and bloggers to secure coverage in relevant publications.
c. Participate in industry events, trade shows, and fashion weeks to increase brand visibility and networking opportunities.
- Search Engine Marketing (SEM) and Search Engine Optimization (SEO):
a. Optimize website content and structure to improve organic search ranking on search engines like Google.
b. Utilize keyword research and on-page optimization to target relevant search queries.
c. Implement paid search campaigns (Google Ads) to capture high-intent search traffic and drive conversions.
- Affiliate and Influencer Marketing:
a. Develop an affiliate program to incentivize bloggers, influencers, and content creators to promote the brand and products in exchange for a commission on sales.
b. Collaborate with influencers on content creation, product reviews, and giveaways to generate buzz and increase brand exposure.
- Offline Advertising and Promotions:
a. Place ads in print magazines, newspapers, or on billboards that cater to your target audience.
b. Host in-store events, pop-up shops, or fashion shows to create memorable experiences and connect with customers.
Financials
Video Tutorial on Financials
Break-Even Analysis:
Liquidity

Income Statement
| All monetary figures are in USD | 2024F | 2025F | 2026F |
| Revenue | |||
| Revenue Item 1 | $430,500 | $1,272,119 | $2,362,261 |
| Revenue Item 2 | $149,240 | $551,252 | $1,023,646 |
| Revenue Item 3 | $275,520 | $678,464 | $1,259,872 |
| Total | $855,260 | $2,501,835 | $4,645,780 |
| Cost of Goods Sold | |||
| COGS1 | $150,675 | $445,242 | $826,791 |
| COGS2 | $52,349 | $193,362 | $359,064 |
| COGS3 | $96,432 | $237,462 | $440,955 |
| Payment processing fees | $25,658 | $75,055 | $139,373 |
| Packaging fess | $8,553 | $25,018 | $46,458 |
| In- bound shipping cost | $12,829 | $37,528 | $69,687 |
| Total | $346,495 | $1,013,667 | $1,882,328 |
| Gross Profit | $508,765 | $1,488,168 | $2,763,452 |
| Operating Profit | |||
| Salaries | $390,000 | $390,000 | $390,000 |
| Promotional expenses | $52,500 | $90,289 | $132,190 |
| Others | $68,421 | $200,147 | $371,662 |
| Total | $510,921 | $680,436 | $893,853 |
| EBITDA | -$2,156 | $807,732 | $1,869,599 |
| Depreciation | $15,000 | $17,305 | $22,930 |
| EBT | -$17,156 | $790,427 | $1,846,668 |
| Retained earnings | -$17,156 | $773,271 | $2,619,939 |
Cash Flow Statement
| All monetary figures are in USD | 2024F | 2025F | 2026F |
| Cash Flow from Operating Activities | |||
| EBIT | -$17,156 | $790,427 | $1,846,668 |
| Depreciation | $15,000 | $17,305 | $22,930 |
| Payables | |||
| Salaries payables | $32,500 | $32,500 | $32,500 |
| Total payables | $32,500 | $32,500 | $32,500 |
| change in payables | $32,500 | $0 | $0 |
| Receivables | |||
| Revenue related receivables | $71,272 | $208,486 | $387,148 |
| Total receivables | $71,272 | $208,486 | $387,148 |
| change in receivables | -$71,272 | -$137,215 | -$178,662 |
| Inventory | |||
| COGS inventory | $74,864 | $219,017 | $406,703 |
| Total inventory | $74,864 | $219,017 | $406,703 |
| change in inventory | -$74,864 | -$144,153 | -$187,686 |
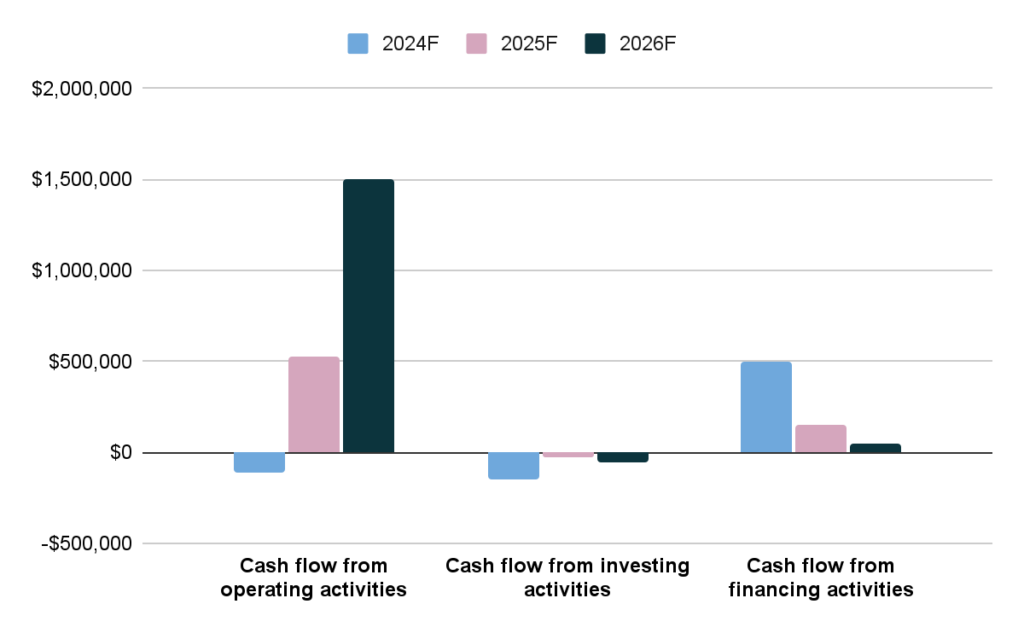
| Net cash flow from operating activities | -$115,792 | $526,365 | $1,503,251 |
| Cash Flow from Investing Activities | |||
| Item 1 | $50,000 | $7,684 | $18,750 |
| Item 2 | $50,000 | $7,684 | $18,750 |
| Item 3 | $50,000 | $7,684 | $18,750 |
| Net cash flow from investing activities | -$150,000 | -$23,053 | -$56,251 |
| Cash Flow from Financing Activities | |||
| Equity | $500,000 | $150,000 | $50,000 |
| Net cash flow from financing activities | $500,000 | $150,000 | $50,000 |
| Net (decrease)/ increase in cash/ cash equivalents | $234,208 | $653,312 | $1,496,999 |
| Cash and cash equivalents at the beginning of the year | $0 | $234,208 | $887,521 |
| Cash & cash equivalents at the end of the year | $234,208 | $887,521 | $2,384,520 |
Balance Sheet
| All monetary figures are in USD | 2024F | 2025F | 2026F |
| Non- Current Assets | |||
| Item 1 | $50,000 | $57,684 | $76,435 |
| Item 2 | $50,000 | $57,684 | $76,435 |
| Item 3 | $50,000 | $57,684 | $76,435 |
| Total non- current assets | $150,000 | $173,053 | $229,304 |
| Accumulated Depreciation | $15,000 | $32,305 | $55,236 |
| Net non- current assets | $135,000 | $140,747 | $174,068 |
| Current Assets | |||
| Inventory | $74,864 | $219,017 | $406,703 |
| Cash | $234,208 | $887,521 | $2,384,520 |
| Receivables | $71,272 | $208,486 | $387,148 |
| Total current- assets | $380,344 | $1,315,023 | $3,178,371 |
| Total assets | $515,344 | $1,455,771 | $3,352,439 |
| Liabilities | |||
| Accounts payable | $32,500 | $32,500 | $32,500 |
| Total liabilities | $32,500 | $32,500 | $32,500 |
| Equities | |||
| Equity | $500,000 | $650,000 | $700,000 |
| Retained earnings | -$17,156 | $773,271 | $2,619,939 |
| Total equity | $482,844 | $1,423,271 | $3,319,939 |
| Total liabilities & equities | $515,344 | $1,455,771 | $3,352,439 |
| 0 | 0 | 0 |
Revenue Summary
| All monetary figures are in USD | 2024F | 2025F | 2026F |
| Total No. of sales | 11,480 | 33,923 | 62,994 |
| Revenue Item 1 | |||
| Revenue | $430,500 | $1,272,119 | $2,362,261 |
| No. of sales | 5,740 | 16,962 | 31,497 |
| Revenue Item 2 | |||
| Revenue | $149,240 | $551,252 | $1,023,646 |
| No. of sales | 2,296 | 8,481 | 15,748 |
| Revenue Item 3 | |||
| Revenue | $275,520 | $678,464 | $1,259,872 |
| No. of sales | 3,444 | 8,481 | 15,748 |
| Total revenue | $855,260 | $2,501,835 | $4,645,780 |
Cost Summary
| All monetary figures are in USD | 2024F | 2025F | 2026F |
| Cost of Goods Sold | |||
| COGS1 | $150,675 | $445,242 | $826,791 |
| COGS2 | $52,349 | $193,362 | $359,064 |
| COGS3 | $96,432 | $237,462 | $440,955 |
| Payment processing fees | $25,658 | $75,055 | $139,373 |
| Packaging cost | $8,553 | $25,018 | $46,458 |
| Shipping cost | $12,829 | $37,528 | $69,687 |
| Total COGS | $346,495 | $1,013,667 | $1,882,328 |
| Operating Cost | |||
| Salaries | $390,000 | $390,000 | $390,000 |
| Promotional expenses | $52,500 | $90,289 | $132,190 |
| Legal & professional expenses | $8,553 | $25,018 | $46,458 |
| Employee travel and relevant expenses | $25,658 | $75,055 | $139,373 |
| Miscellaneous | $17,105 | $50,037 | $92,916 |
| Spillage & wastage | $17,105 | $50,037 | $92,916 |
| Total Operating Cost | $510,921 | $680,436 | $893,853 |
| Total Cost | $857,416 | $1,694,103 | $2,776,181 |
Salaries
| All monetary figures are in USD | 2024F | 2025F | 2026F |
| Manager | $30,000 | $30,000 | $30,000 |
| Salesperson | $30,000 | $30,000 | $30,000 |
| Customer service representative | $30,000 | $30,000 | $30,000 |
| Accountant/Bookkeeper | $30,000 | $30,000 | $30,000 |
| Marketing specialist | $30,000 | $30,000 | $30,000 |
| Operations specialist | $30,000 | $30,000 | $30,000 |
| IT specialist/Computer technician | $30,000 | $30,000 | $30,000 |
| Human resources specialist | $30,000 | $30,000 | $30,000 |
| Production worker/Assembler | $30,000 | $30,000 | $30,000 |
| Delivery driver/Logistics specialist | $30,000 | $30,000 | $30,000 |
| Graphic designer/Visual artist | $30,000 | $30,000 | $30,000 |
| Content writer/Blogger | $30,000 | $30,000 | $30,000 |
| Social media specialist | $30,000 | $30,000 | $30,000 |
| Total | $390,000 | $390,000 | $390,000 |
Non- Current Asset Schedule
| All monetary figures are in USD | 2024F | 2025F | 2026F |
| Item 1 | $50,000 | $57,684 | $76,435 |
| depreciation | $5,000 | $5,768 | $7,643 |
| accumulated Depreciation | $5,000 | $10,768 | $18,412 |
| Net book value | $45,000 | $46,916 | $58,023 |
| Item 2 | $50,000 | $57,684 | $76,435 |
| depreciation | $5,000 | $5,768 | $7,643 |
| accumulated Depreciation | $5,000 | $10,768 | $18,412 |
| Net book value | $45,000 | $46,916 | $58,023 |
| Item 3 | $50,000 | $57,684 | $76,435 |
| depreciation | $5,000 | $5,768 | $7,643 |
| accumulated Depreciation | $5,000 | $10,768 | $18,412 |
| Net book value | $45,000 | $46,916 | $58,023 |
| Total Net book value | $135,000 | $140,747 | $174,068 |
| Total Depreciation | $15,000 | $17,305 | $22,930 |
| Total Accumulated Depreciation | $15,000 | $32,305 | $55,236 |
Related Articles
Business Ideas for Single Mothers in 2024
Small Business Grant for Business Owners in 2024
Business Registration Complete Process in USA
How to Avoid a Business Failure: Create a Successful Business
