Written by Elma Steven | Updated on April, 2024
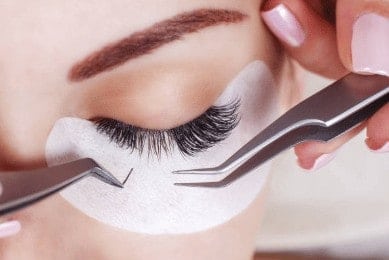
How to Write an Eyelash Extension Business Plan?
In order to write a Eyelash Extension Business Plan you need to start with executive summary. In order to write an executive summary for a Business Plan you need to mention- what your business is about and what you’ll sell. Explain how you’ll get people to buy it. The executive summary should be written at the end. Then you should write a Business Description mentioning goals, objectives, mission and vision. Some of the major sections or components of a Business Plan involves Fund Usage Plan, Marketing Plan, Industry Analysis, Organizational Overview, Operational Overview and Financials.
Table of Contents
Executive Summary
Overview: When you look nice, you feel good. La Vie Lashbar believes that each customer is distinct and valuable; each pair of lashes must represent the client’s preferences, style, and lash manageability. We want our customers to understand the application process, have the skills to properly care for them, and be aware of the many looks and alternatives available. Quality, not quantity, is what La Vie is all about. Our lash sets are handcrafted using high-quality materials, advanced training, and expertise. Because it is our clients’ delight that genuinely motivates us, we never sacrifice quality to save time or money. The materials we utilize, comprehensive application procedures, and how we serve our customers give us confidence that we are providing an excellent experience.
Mission: To enhance beauty and confidence through premium eyelash extensions, providing personalized and safe experiences that make every client feel and look their best.
Vision: To be the premier choice in eyelash beauty, empowering individuals with confidence and leading the industry in quality, innovation, and sustainability.
Industry Overview:
The global eyelash extension market, valued at approximately $1.5 billion in 2023, is witnessing rapid growth within the beauty sector. This expansion is propelled by increasing consumer focus on personal grooming and the popularity of eyelash extensions as an easy beauty enhancement. Influences from social media and celebrity endorsements are significantly boosting demand. Innovations in materials and application techniques are further enriching the variety and appeal of eyelash extensions, meeting varied customer needs and driving the market forward. Check out this guide on how to write an executive summary? If you don’t have the time to write on then you can use this custom Executive Summary Writer to save Hrs. of your precious time.
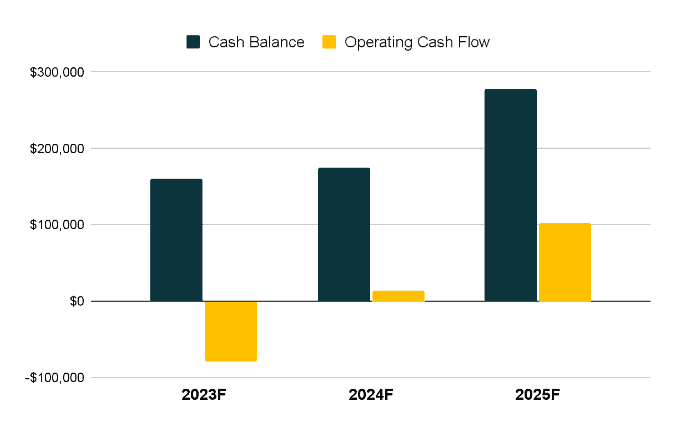
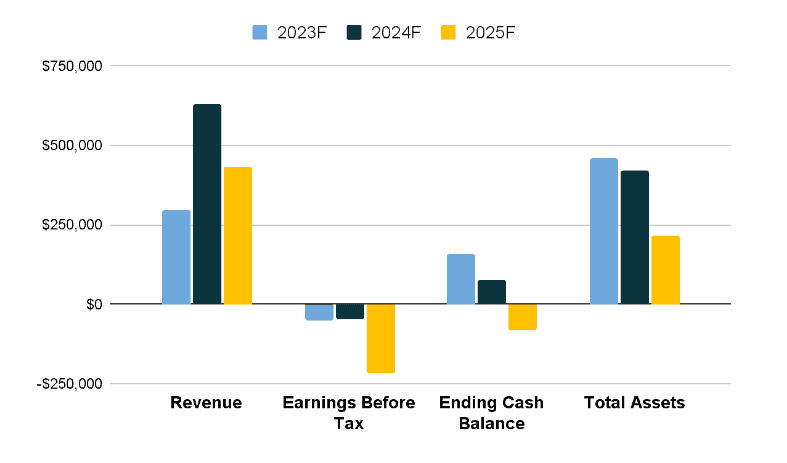
Financial Overview:
Business Description
Business Name:
Founder: Jacob Harris
Management Team:

Legal Structure: LLC
Location:
Goals:
- To offer a wide range of high-quality eyelash products and services that meet the needs and preferences of our customers.
- To provide personalized and friendly customer service that exceeds customer expectations.
- To continuously improve and innovate our products and services to stay ahead of industry trends and meet the changing needs of our customers.
- To achieve financial stability and growth by maximizing revenue and profitability.
Products:
[Mention your services in bullet points]
Download Free Eyelash Extension Business Plan Template
Write a plan in just 2 days!
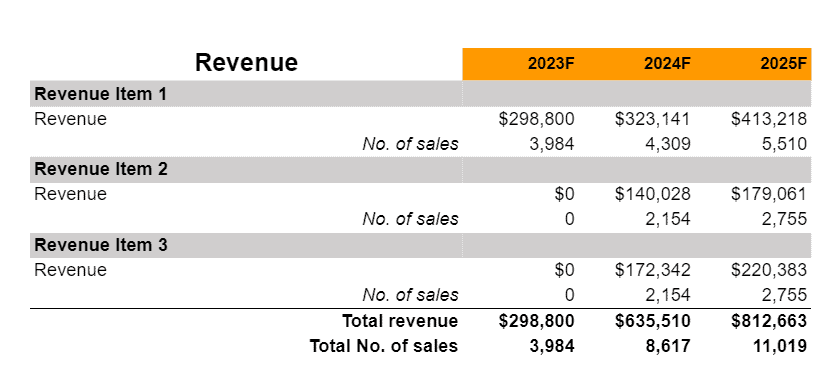
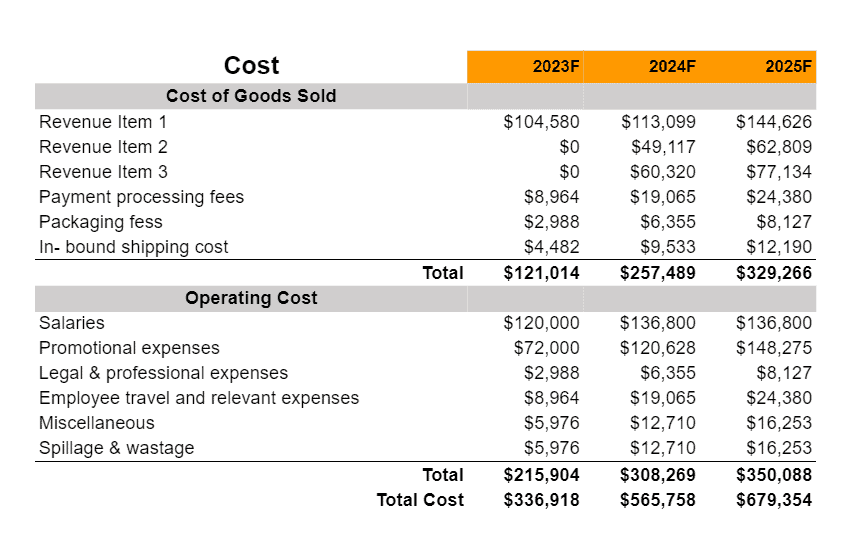
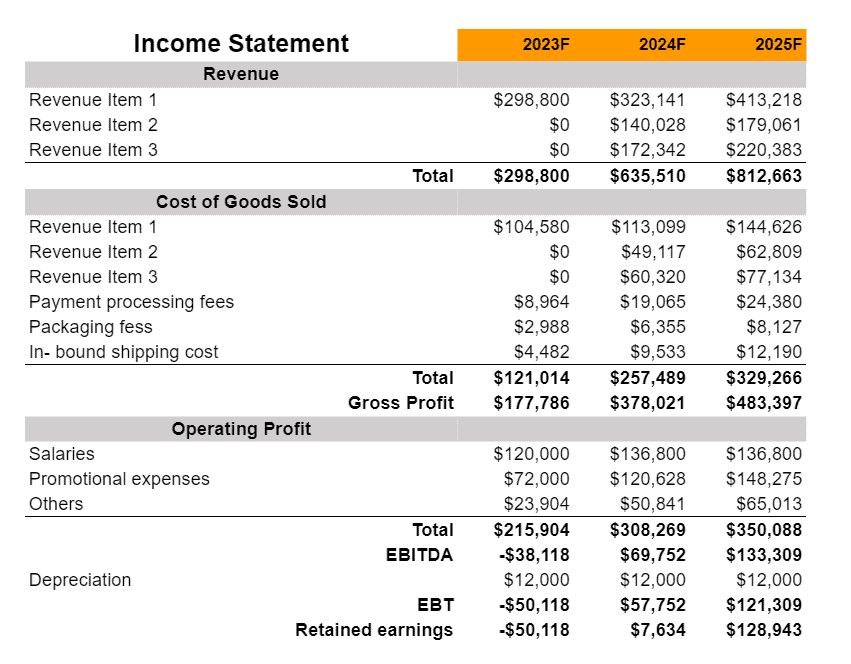
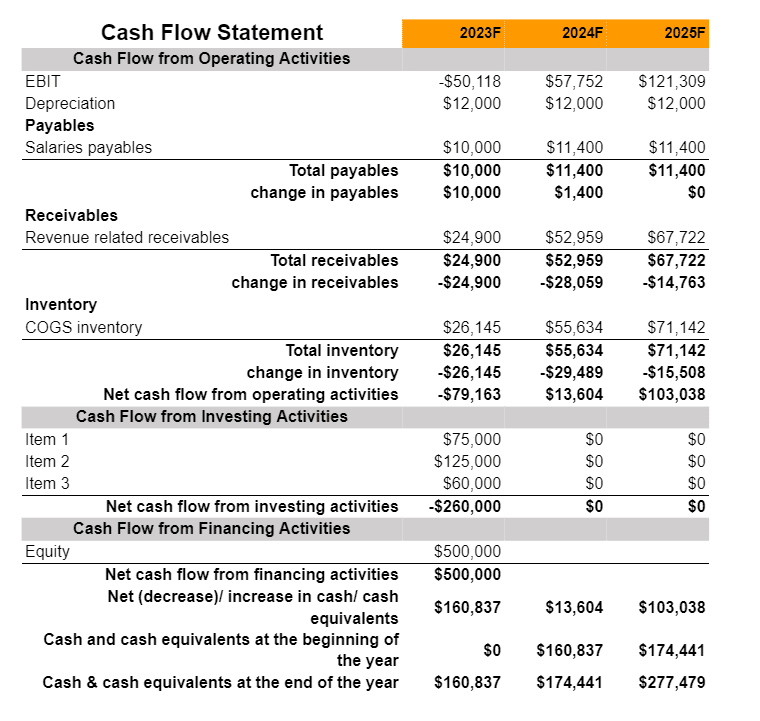
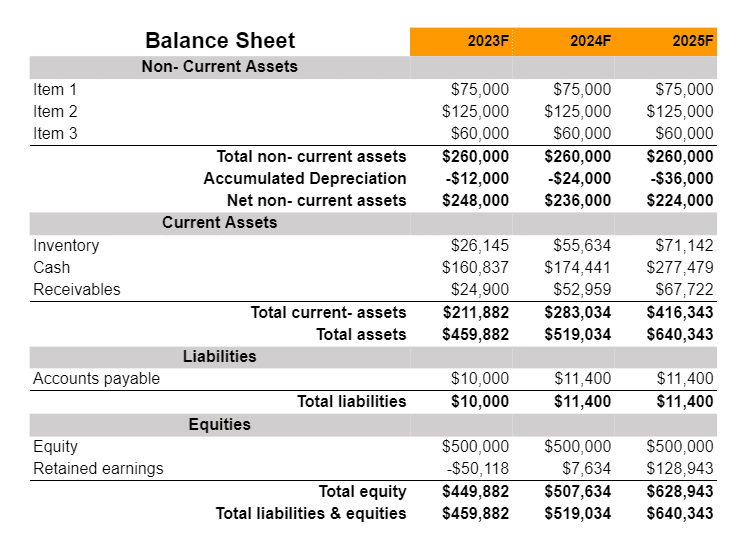
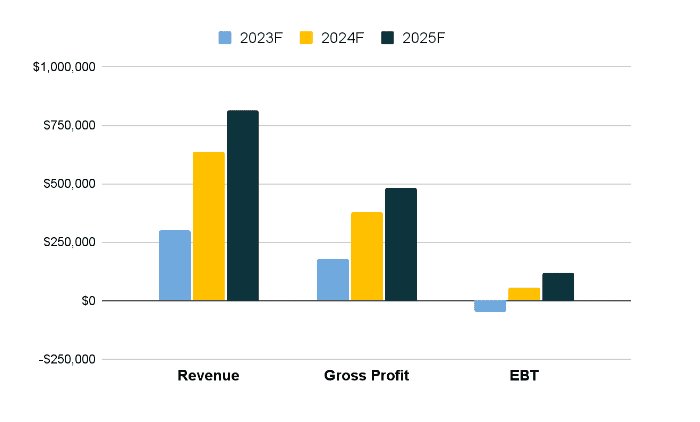
Financial Overview
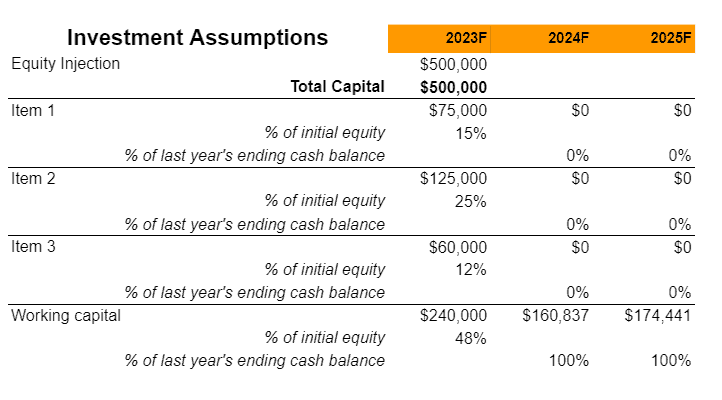
Fund Usage Plan
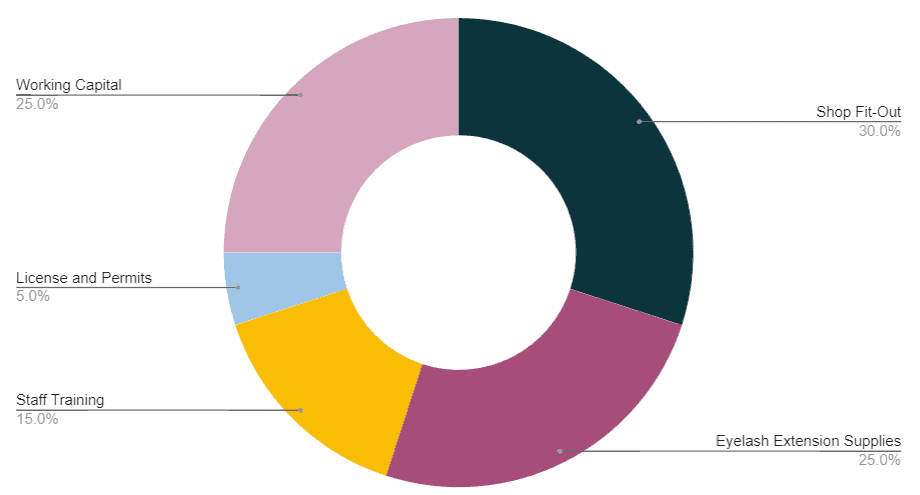
Key Metrics:

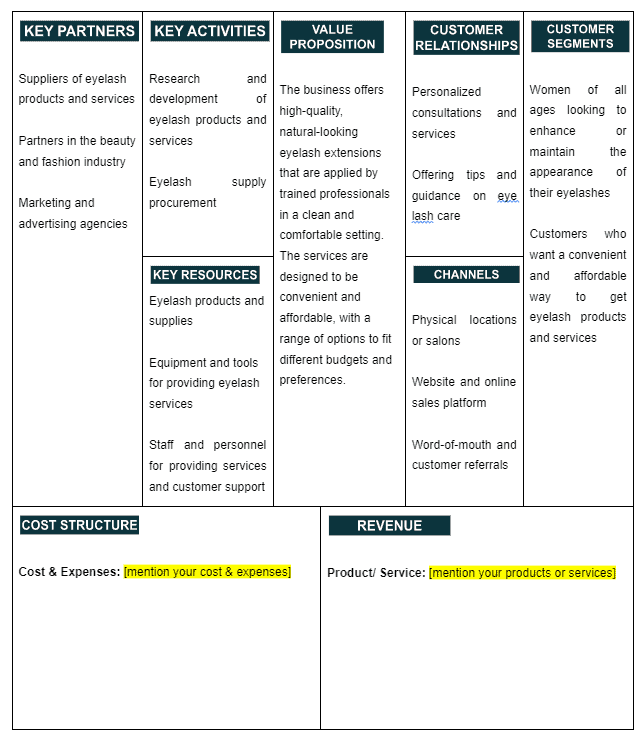
Business Model Canvas
Check out 100 samples of business model canvas.
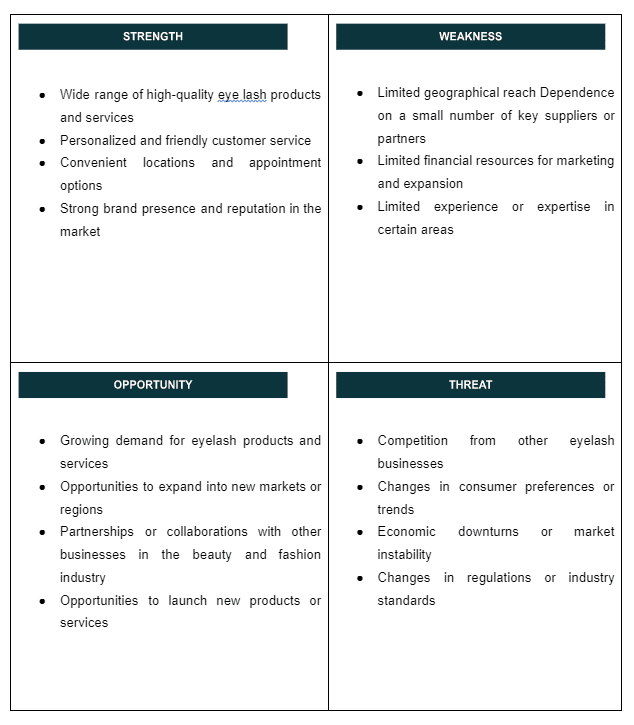
SWOT
Check out the 100 SWOT samples which will give you a better idea on SWOT writing process.
Organizational Overview
Founder

My name is Jacob Harris, and I own a business that specializes in the elongation of eyelashes. The ability of beauty to improve one’s self-confidence as well as one’s outward look has always been something that has attracted me. My interest in the area of lash augmentation was piqued when I discovered the artistry and accuracy involved in applying eyelash extensions; as a result, I decided to launch my own company.
My eyelash extension workshop was founded on the principles of meticulous attention to detail and an unwavering dedication to the achievement of the highest possible standards. I am of the opinion that each and every customer should have the opportunity to partake in a bespoke and exquisite service that takes into account their own characteristics and the overall appearance they like to achieve. Enhancing a woman’s natural attractiveness and making an impression that will endure are two of my primary goals when applying false eyelashes, whether they be traditional or volumized sets.
As a business owner who specializes in eyelash extensions, I make it a point to put my customers’ wellbeing and protection first. In order to provide a setting that is both secure and pleasant for those who visit, I am very careful when choosing things of a high quality. In addition, I adhere to very stringent hygiene regulations. I make it a point to be abreast of the most recent developments in the field, both in terms of trends and procedures, and to continually hone my abilities in order to provide the lash extension services that are the most cutting-edge and in-demand.
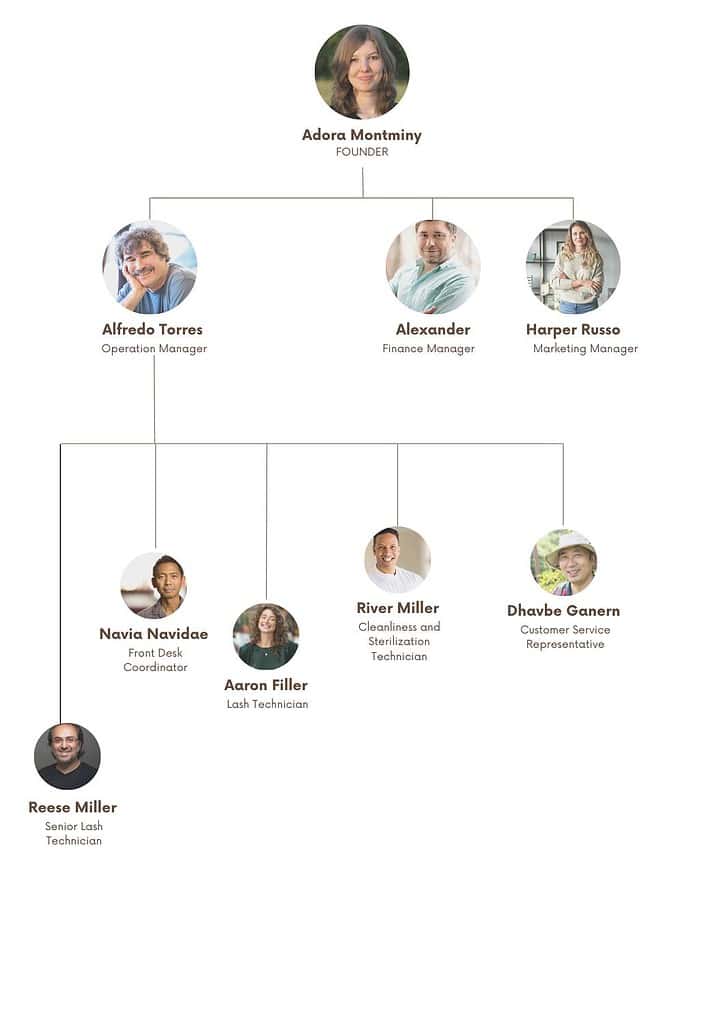
Organogram
Industry Analysis
The eyelash extension industry forms a dynamic segment within the broader beauty and cosmetics market, experiencing a remarkable upswing in recent years. As of 2023, the global market for eyelash extensions is estimated at around $1.5 billion, showcasing the industry’s growing prominence. This growth trajectory is primarily driven by a rising consumer emphasis on personal appearance and the increasing popularity of eyelash extensions as a convenient method for enhancing facial aesthetics. The market is also benefiting from the growing influence of beauty trends on social media and the endorsements of celebrities, which have significantly raised consumer awareness and desire for these beauty enhancements.
Technological advancements and innovations in the eyelash extension sector play a pivotal role in its expansion. The introduction of new materials and improved application techniques has allowed for a wider variety of styles, lengths, and volumes, catering to diverse customer preferences. These developments not only enhance the quality and durability of eyelash extensions but also minimize potential health risks, making the procedure more appealing to a broader audience. Additionally, the rise in professional training programs for eyelash technicians ensures higher service standards, further bolstering consumer trust and industry growth.
Looking forward, the eyelash extension industry is poised for sustained growth, with forecasts suggesting a continuous rise in market value and consumer demand. The trend towards personal grooming and the pursuit of customized beauty solutions are key factors propelling this growth. Moreover, the increasing accessibility of eyelash extension services through beauty salons and specialized studios, coupled with competitive pricing, is making these beauty enhancements more attainable to a wider demographic. As the industry evolves, it is expected to see further innovation in product offerings and application techniques, ensuring its relevance and appeal in the ever-changing landscape of the beauty market.

Source: stratviewresearch
From 2019 to 2025, the market for individual fake eyelashes is predicted to grow at 6.0 percent. Customers may choose from single or flared versions, and they have a natural yet striking appearance. Although temporary and permanent artificial eyelash extensions are available, most customers prefer to wear them for a longer period since they are time-consuming. Each lash, or cluster of lashes, must be applied one at a time, and specialist assistance is typically required.
From 2019 to 2025, the natural eyelash extension market is predicted to develop at a steady 5.2 percent CAGR. Mink Hair, ebony hair, human hair, or silk are used to make these items. In comparison to their counterparts, they are lighter in weight, have a finer texture, and are considerably more flexible. They have a smooth texture that mimics natural lashes, and their low weight makes them simple to apply daily.
False eyelashes improve the look of natural hair by adding volume, lengthening it, or adding volume. Consumer demand for self-grooming items such as fake eyelashes is fueled by rising disposable money and an increased desire to improve physical appearance. The middle-buying class’s habits and living standards quickly change as per capita disposable income rises. Hair extension products have become more important in terms of income and usage as the fashion and entertainment industries have grown.
North America, Europe, Asia-Pacific (APAC), the Middle East and Africa (MEA), and South and Central America are the five main areas in which the artificial eyelashes market is divided (SAM). Europe will have the highest share of the global fake eyelash market in 2020. The expansion of the fake eyelashes market is driven by the region’s rapidly increasing demand for ornamental cosmetics goods such as nail care, eye makeup, lip care, and many others. The fashion and beauty sector is centered in Europe. Some of the key drivers driving the development of the regional market are Europe’s thriving beauty and fashion sector and quickly rising eye makeup trends.
One of the primary factors of the eyelash extension market’s development is the rising demand for eyelash extensions among the millennial generation. Millennials are brand loyalists willing to pay a premium for a high-quality product. The market for eyelash extensions will be driven by the rising popularity of personal care and cosmetic goods among millennials. One of the key difficulties for the worldwide eyelash extension market’s development is the availability of low-cost solutions in the unorganized sector. According to Technavio’s recent analysis, the worldwide eyelash extension market is expected to increase at a CAGR of 4.48 percent from 2021 to 2026.

Source: verifiedmarketresearch
Strip lashes and individual lashes are the two types of fake eyelashes available worldwide. In 2020, the worldwide fake eyelashes market will be dominated by strip lashes. Strip lashes are a pre-made band of lashes with a removable adhesive applied to the eyelids. Consumers who use artificial eyelashes daily like these types since they are the fastest and simplest to apply. These products are user-friendly since they cover the whole lash line with one application.
Human hair, synthetic and animal hair & fur make up the fake eyelashes industry. In 2020, the synthetic category led the market, and this dominance is likely to continue throughout the forecast period. On the other hand, human hair lashes are predicted to increase at the fastest pace in the future years. They are more delicate than synthetic lashes but thicker than mink lashes and mirror the appearance of one’s eyelashes. If stored in a cool, dry environment, human hair lashes may be reused many times.
Supermarkets and hypermarkets, specialty shops, internet shopping, and other distribution channels are used to segment the market. In terms of value, the worldwide fake eyelashes market in 2020 was led by supermarkets and hypermarkets. These retailers have concentrated on offering a variety of categories to captivate clients and give
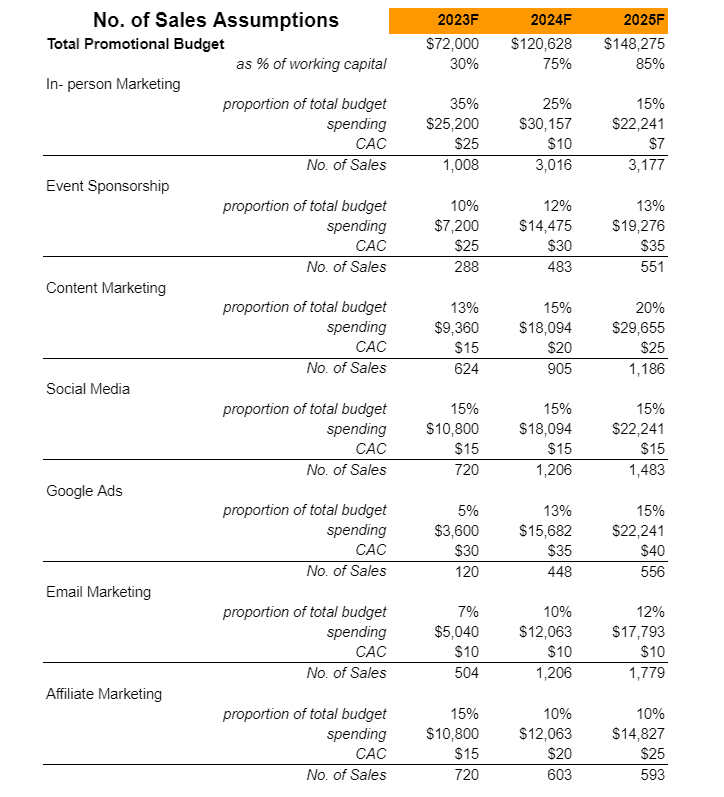
Marketing Plan

Content Marketing: Create a blog on your Blackbird Acupuncture website on what you has to offer to prospective customers.
Discounts: Provide multiple rewards or incentives to Blackbird Acupuncture‘s frequent customers, you’ll be more likely to attract them. Create a member referral scheme, for example, where members get a discount if they successfully recommend someone.
Social Media: Engage and promote Blackbird Acupuncture on Twitter, publish news on Facebook, and utilize Instagram to promote curated photos of your clinic.
SEO (Search Engine Optimization) Local SEO makes it easier for local consumers to find out what you have to offer and creates trust with potential members seeking for what your clinic has to offer.
Email Marketing: Blackbird Acupuncture will be sending automated in-product and website communications to reach out to consumers at the right time. Remember that if your client or target views your email to be really important, they are more likely to forward it or share it with others, so be sure to include social media share.
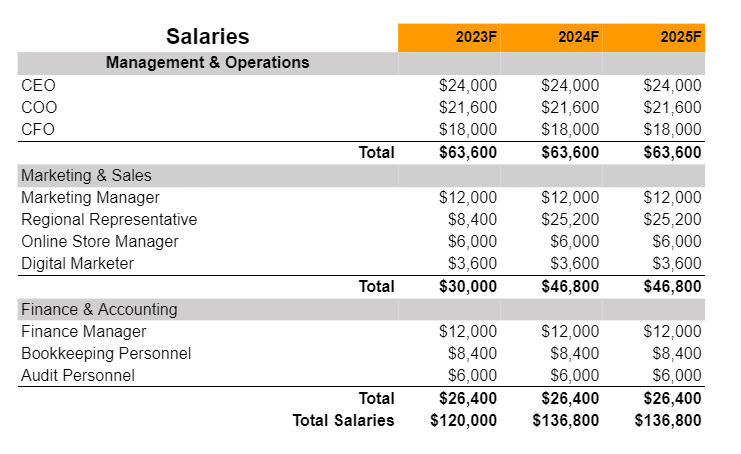
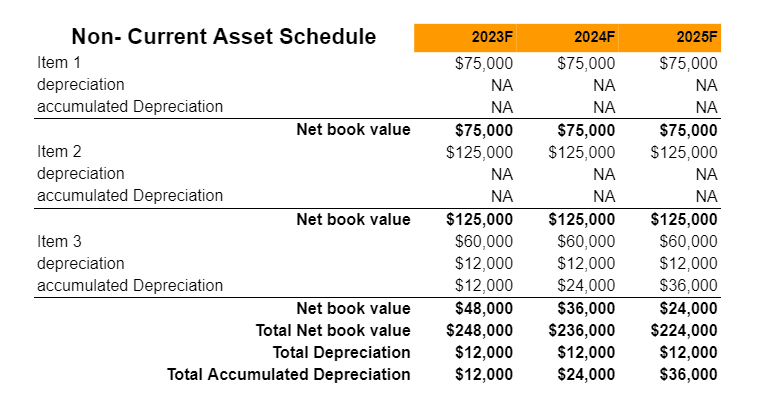
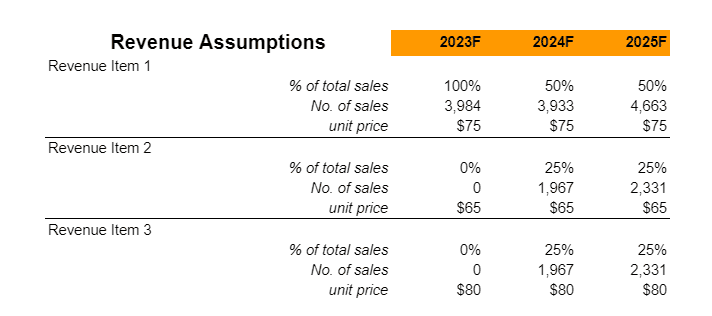
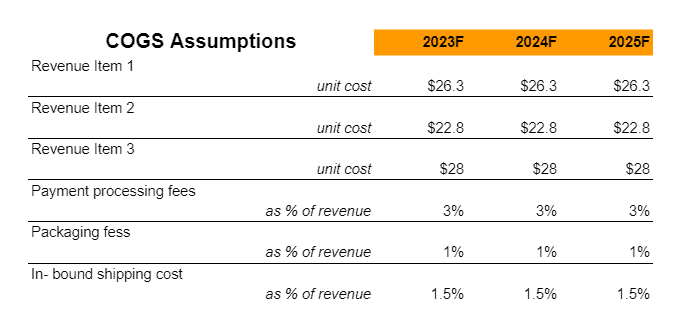
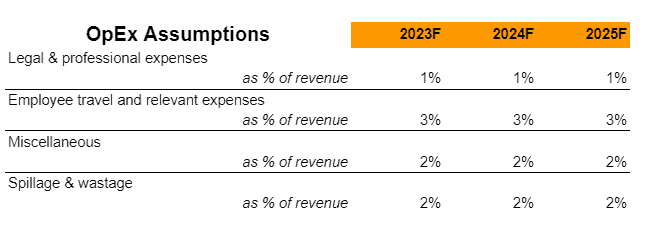
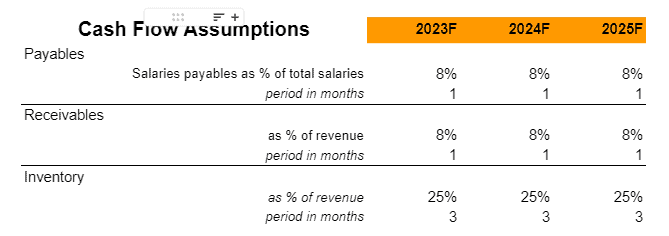
Financials
Earnings
Liquidity
