Written by Elma Steven | Updated on April, 2024
How to Write a Medical Spa Business Plan?
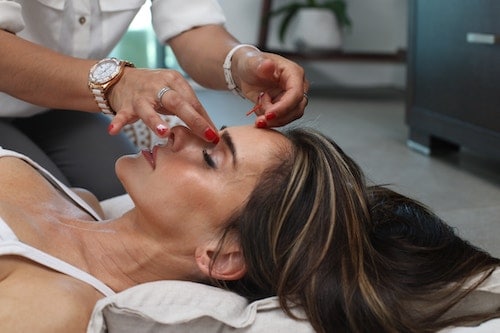
Medical Spa Business Plan is an outline of your overall business. The business plan includes 5 year projection, marketing plan, industry analysis, organizational overview, operational overview and finally the executive summary. Remember to write your executive summary at the end as it is considered as a snapshot of the overall business plan. The creation of a business plan requires careful consideration of various factors that might impact the business’s success. Ultimately the plan serves as a roadmap to guide the company’s direction.
Table of Contents
Executive Summary
Overview: Luxe Aesthetic Facility, which first opened its doors in 2006, has swiftly established itself as North Orange County’s top aesthetic facility. We provide men and women with the most up-to-date and advanced treatment options for skin rejuvenation and improved appearance. We started to provide honest, ethical, and high-quality services. Our private and intimate location allows our patients to relax and forget their worries. Medical aestheticians and experienced practitioners collaborate with you to achieve your ideal beauty objectives. We try to make you feel and look your best by specializing in results-oriented skincare treatments targeted to your specific lifestyle.
Mission: Luxe Aesthetic Center’s mission is to enhance our customers’ health and wellbeing by using proven, safe, and effective products and technology.
Vision: Our goal is to be the community’s leading beauty and skincare center by delivering outstanding, consistent skincare and health promotion via education and practice.
Financial Overview:
Industry Overview:
In 2022, the global market for industry was worth USD 16.4 billion. From 2023 to 2030, it is projected to grow at a compound annual growth rate (CAGR) of 14.97%. The market is growing because people are becoming more aware of self-care and anti-aging services, and the health tourism industry is growing quickly. The American Med Spa Association (AMSA) says that there is a high demand for minimally invasive treatments like chemical peels and non-surgical skin shaping, as well as body modeling and tattoo removal. Also, hotels that offer health deals are making wellness-themed holidays very popular.
Check out this guide on how to write an executive summary? If you don’t have the time to write on then you can use this custom Executive Summary Writer to save Hrs. of your precious time.
Business Description
Business Name:
Founder: Jacob Harris
Management Team:

Legal Structure: LLC
Location:
Goals:
✅ To offer a wide range of high-quality, results-driven treatments and services that are safe and effective.
✅ To create a relaxing and luxurious environment that promotes relaxation and healing.
✅ To continually educate our team on the latest technologies and techniques in the industry.
✅ To provide personalized care and exceptional service to each and every one of our clients.
Products:
✅ Aesthetic Treatments
✅ Skincare Products
✅ Spa Packages
Download Free Business Plan Template
Write a plan in just 2 days!
Financial Overview
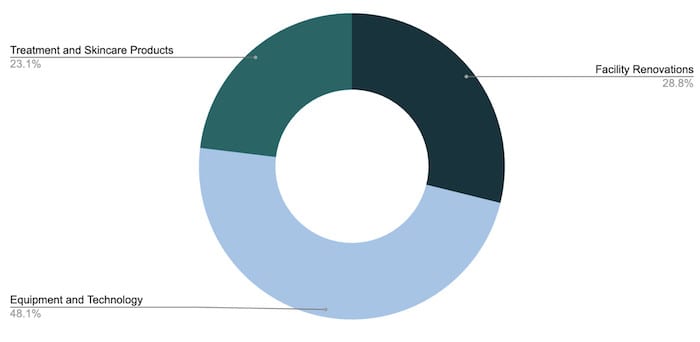
Fund Usage Plan
Key Metrics

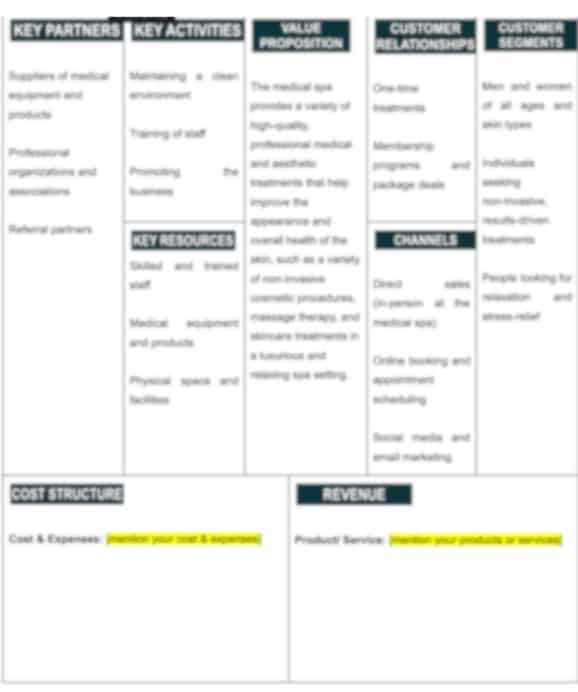
Business Model Canvas
Check out 100 samples of business model canvas.
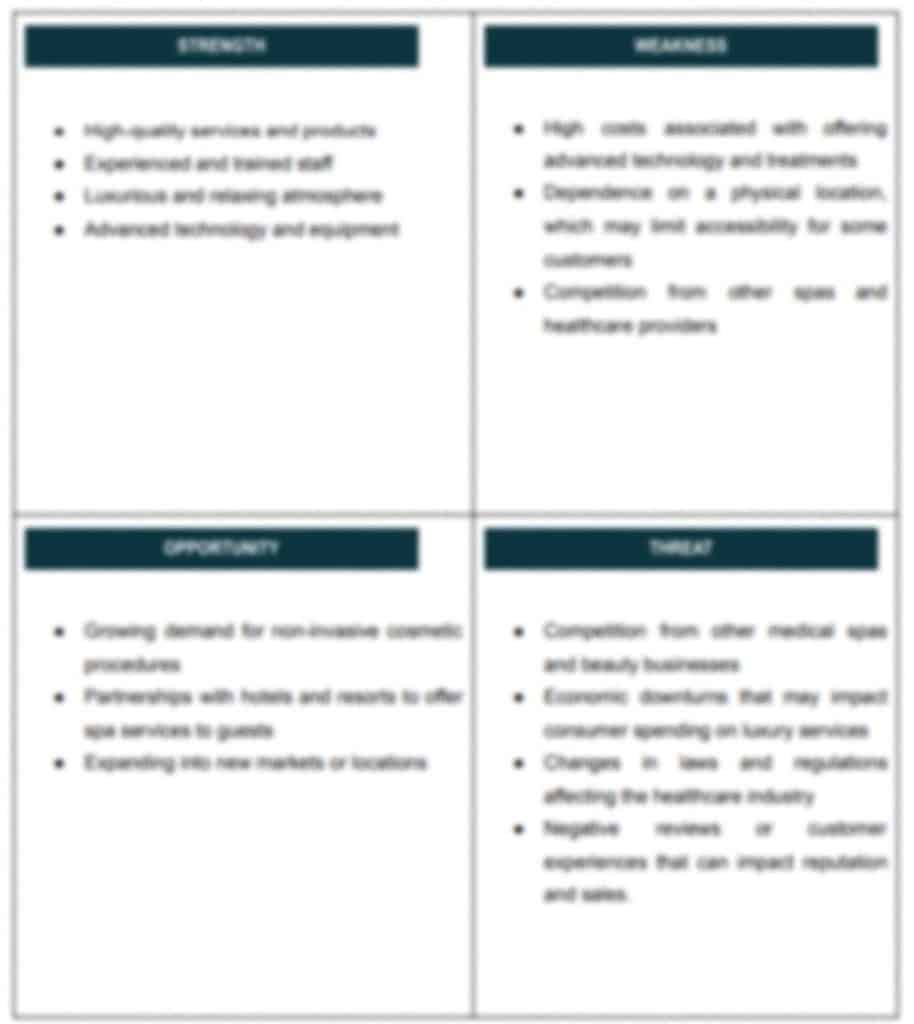
SWOT
Check out the 100 SWOT samples which will give you a better idea on SWOT writing process.
Organizational Overview
This outlines the ownership structure, roles, responsibilities of key management personnel, and the reporting hierarchy within the organization. This section offers stakeholders, investors and other readers a clear understanding of the company’s leadership and its chain of command. Additionally, it may give insight into the company’s culture, values and operational philosophy.
Founder

An extremely popular business is run by Jacob Harris, an experienced businessman with a strong interest in health and beauty. Jacob’s strong educational background and long list of accomplishments make him a priceless asset to his project and guarantee its success.
By combining his extensive training in aesthetic medicine with a deep understanding of the newest beauty trends, Jacob is able to provide excellent skin care and restoration services. His schooling and work experience in the field have polished his ability to give his clients customized and effective solutions.
Jacob’s past accomplishments show how dedicated he is to customer happiness and success. He has built a high-quality spa that provides many cutting-edge services, such as anti-aging and skin care treatments, body shaping, and health services. As a result of his guidance, the spa has gotten great reviews for its helpful staff, cutting-edge technology, and remarkable outcomes.
Jacob continues to learn and stay ahead of the curve in his field by actively seeking out advanced training and licenses. As a result, he can give the newest methods and services at his spa. By working with trustworthy professionals in the field and spending money on high-quality tools, Jacob makes sure that his Medical Spa stays a popular spot for people looking for the best healing and beauty services.
Organogram

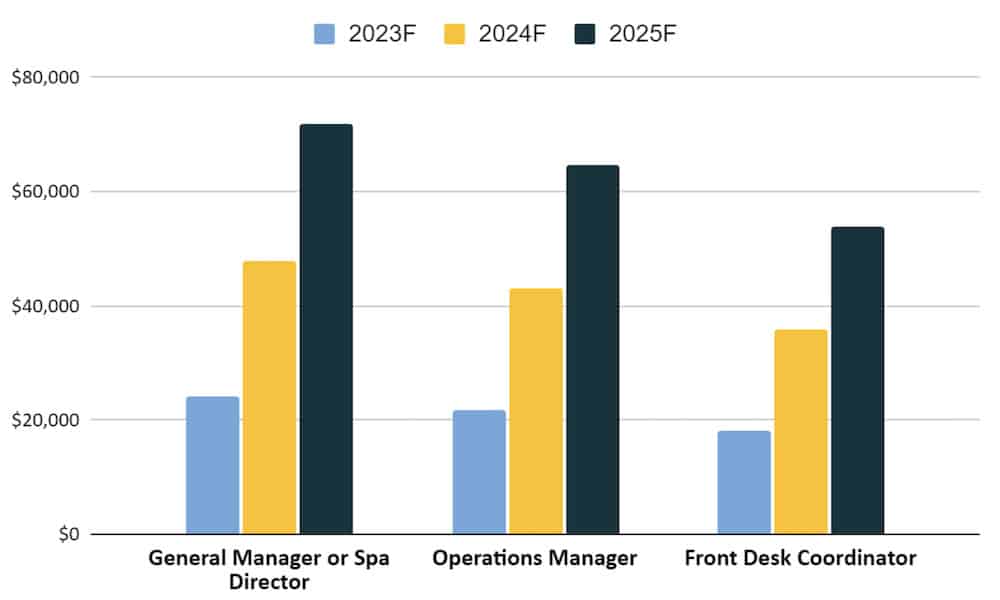
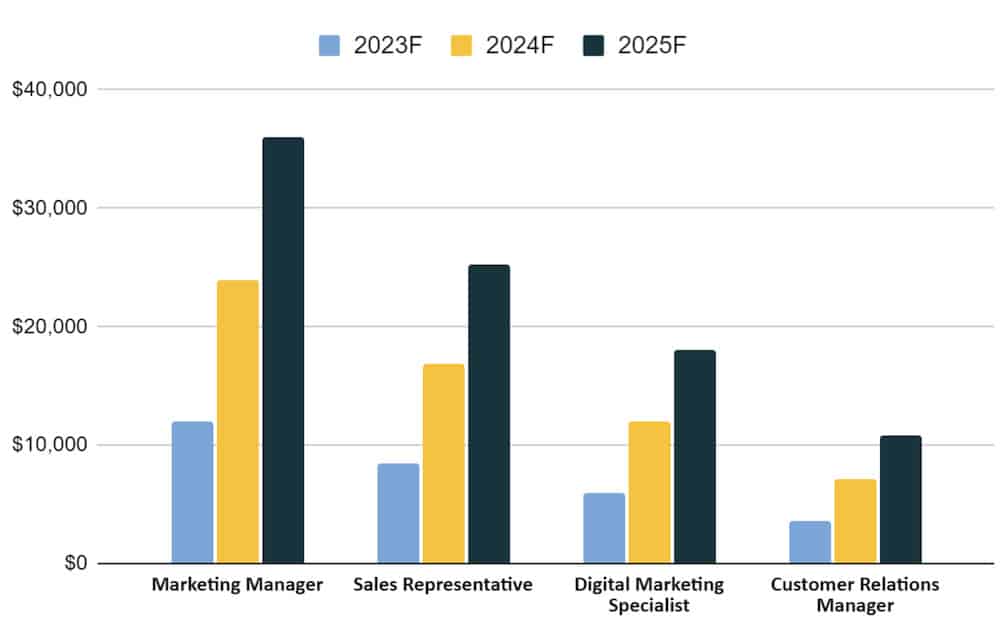
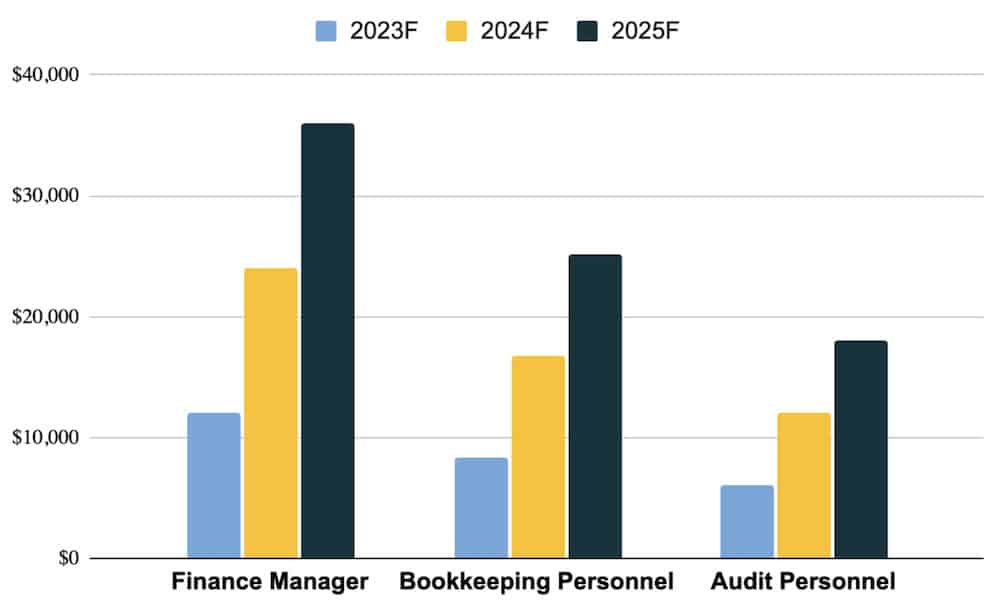
Staff Salaries
Management & Operations:
Marketing & Sales:
Spending on Finance & Accounting:
Industry Analysis
By 2028, the worldwide market will be worth USD 36.8 billion. From 2021 to 2028, the market is projected to grow at a 14.3% CAGR. One of the primary drivers of the market is the growing desire for non-invasive cosmetic treatments. The increased need for dermal fillers and the strong impact of social media among millennials are driving the demand for market. Spa treatments have become more expensive due to technological improvements like laser systems. For example, the average cost of laser skin resurfacing operations grew by almost 15.0 percent in 2016.
Problems & Opportunities
High startup costs: the industry often incur high costs related to purchasing and maintaining advanced technology and equipment, as well as offering a wide range of services. These costs may be difficult to sustain if the business is not generating sufficient revenue.
Dependence on a physical location: industry players are often reliant on a physical location for providing services, which can limit accessibility for some customers and make the business vulnerable to issues such as natural disasters or pandemics.
Regulatory and legal issues: the industry is subject to various regulatory and legal requirements, such as obtaining licenses and permits, complying with privacy laws, and adhering to industry standards. Failure to comply with these requirements can lead to legal and financial problems for the business.
High demand: The demand for non-invasive aesthetic treatments has been increasing in recent years. As people become more aware of the options available to them and the potential benefits of these treatments, they may be more likely to seek out spa services.
Ability to leverage technology: it can leverage the latest technologies, such as laser treatments and advanced skin care products, to offer cutting-edge treatments to their clients.
Ability to adapt to changing client needs: The demand for non-invasive cosmetic procedures can change over time, and spas that are able to adapt and offer the latest treatments can stay ahead of the competition.
Target Market Segmentation
Geographic Segmentation: we are planning to start with certain locations across [targeted locations].
Demographic Segmentation:
Age: Younger customers might be more interested in treatments that address acne and other skin problems, while older customers might be more interested in treatments that address signs of aging such as wrinkles and sagging skin.
Gender: A business might cater to both men and women, or it might focus on one gender in particular. For example, a business might offer treatments such as laser hair removal or Botox that are more commonly sought by women, or it might offer treatments such as beard transplants or hair restoration that is more commonly sought by men (Grandview Research).
Income: Higher-income customers might be willing to pay more for premium treatments and services, while lower-income customers might be more price-sensitive.
Education: Customers with higher levels of education might be more interested in learning about the latest treatments and technologies, while less educated customers might be more focused on the practical benefits of the treatments.
Occupation: Customers with busy, high-stress jobs might be more interested in treatments that help them relax and de-stress, while customers with more leisurely lifestyles might be more interested in treatments that help them look and feel their best.
Psychographic Segmentation:
Personality: Customers who are concerned about their appearance and are willing to invest in their personal grooming might be more likely to use a spa.
Values: Customers who place a high value on self-care and wellness might be more likely to use the services.
Attitudes: Customers who have a positive attitude towards treatments might be more likely to use a medical spa, while customers who have a negative attitude might be less likely to use a medical spa.
Interests: Customers who are interested in fashion, beauty, and personal grooming might be more likely to use a medical spa, while customers who are less interested in these things might be less likely to use a medical spa.
Lifestyle: Customers with busy, high-stress lifestyles might be more likely to use a medical spa as a way to relax and de-stress, while customers with more relaxed, leisurely lifestyles might be more likely to use a medical spa as a way to maintain their appearance.
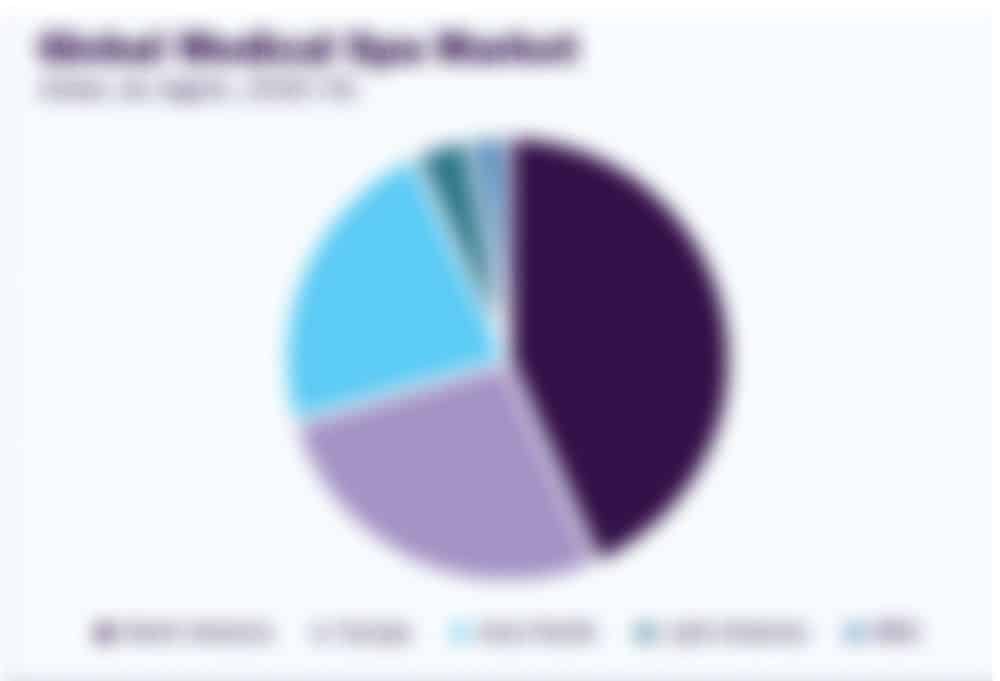
Source: Global Newswire
Market Size
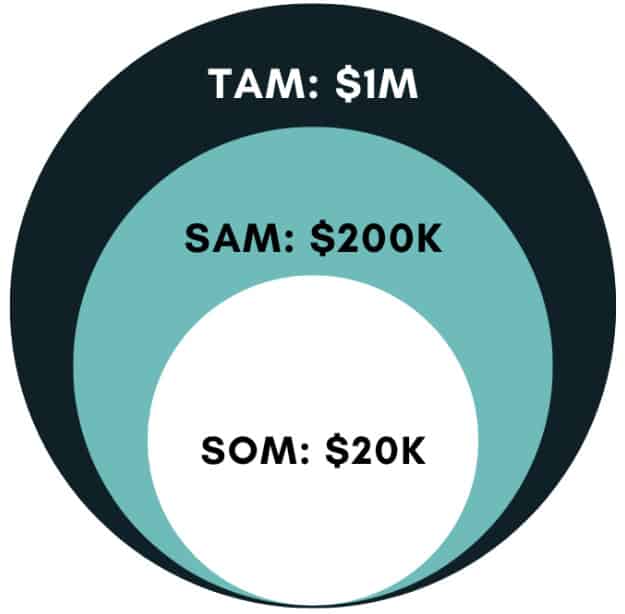
Total Addressable Market: TAM refers to the total demand for a product or service in a specific market. It represents the entire market size without any limitations, assuming there are no constraints or barriers to adoption. TAM represents the maximum revenue opportunity available for a product or service if it were to capture 100% market share. Suppose the business is located in a metropolitan area with a population of 1 million people.). So, our TAM is $1M.
Serviceable Addressable Market: SAM represents the portion of the TAM that a business can realistically target and serve. It takes into account factors such as geographical limitations, target customer segments, and other constraints that may affect the business’s ability to reach the entire market. SAM represents the market segment that aligns with the business’s value proposition and is accessible to the company. Let’s estimate that the business can effectively reach 20% of the potential market, then our SAM is $200K.
Serviceable Obtainable Market: SOM is an even smaller subset of the SAM and represents the portion of the SAM that a company can realistically capture or obtain. It considers the market share that a company can actually achieve in its target market given its strategies, competition, and other factors. Estimate that the business aims to capture 10% of the SAM. So, the estimated SOM is $20K.
Problems & Opportunities
High startup costs
Medical spas often incur high costs related to purchasing and maintaining advanced technology and equipment, as well as offering a wide range of services. These costs may be difficult to sustain if the business is not generating sufficient revenue.
Target Market Segmentation
Geographic Segmentation
We are planning to start with certain locations across [targeted locations].
Demographic Segmentation
Age: Younger customers might be more interested in treatments that address acne and other skin problems. On the other hand, older customers might be more interested in treatments that address signs of aging such as wrinkles and sagging skin.
Psychographic Segmentation
Values: Customers who place a high value on self-care and wellness might be more likely to use a medical spa, while customers who value affordability and practicality might be less likely to use a medical spa.
Personality: Customers who are concerned about their appearance and are willing to invest in their personal grooming might be more likely to use a medical spa, while customers who are less concerned about their appearance might be less likely to use a medical spa.
Behavioral Segmentation
Occasion: Customers who use medical spas on a regular basis might be more likely to use medical spas that offer loyalty programs or discounts for frequent users, while customers who use medical spas less frequently might be more likely to use medical spas that offer one-time services or package deals.
Benefits sought: Customers who value convenience might be more likely to use medical spas that offer mobile or home services, while customers who value a luxurious experience might be more likely to use medical spas that offer a range of amenities such as massage or sauna.
Marketing Plan
It includes specific tactics and channels the business will use to reach potential customers. This section defines the company’s unique value proposition, identifies the target market segments, and discusses the competitive landscape. It also includes insight into budget allocation, projected outcomes and key performance indicators to measure success. Marketing plan helps businesses demonstrate their understanding of the market dynamics, their positioning within the industry and their approach to driving customer engagement and sales.

Financials
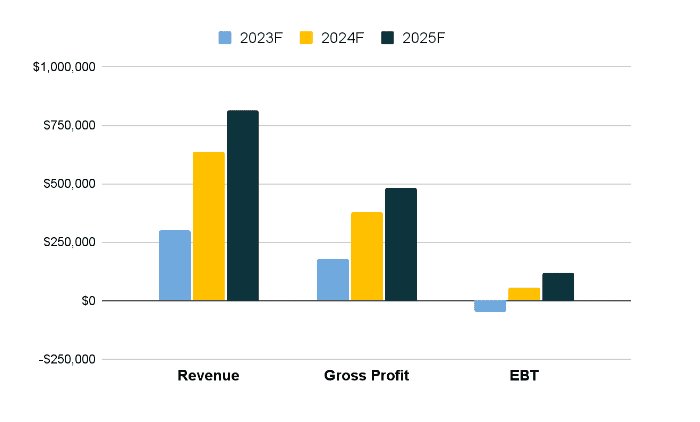
Earnings
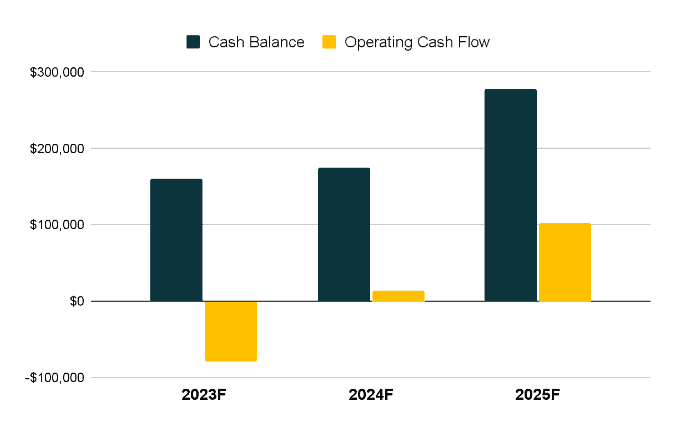
Liquidity
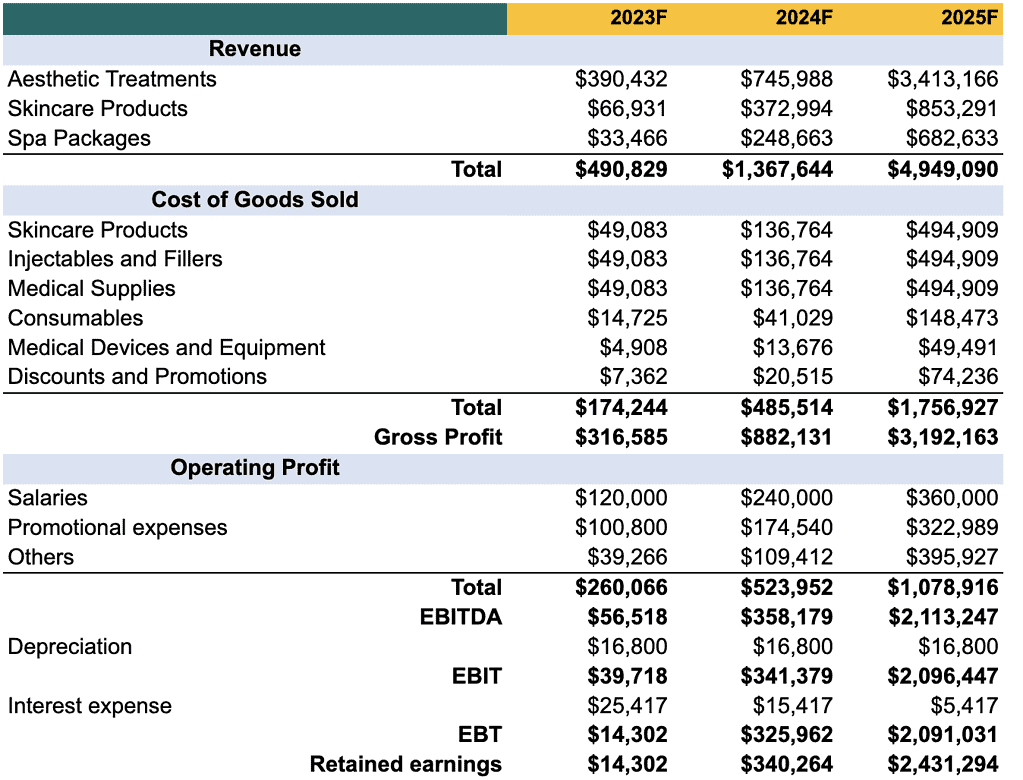
Income Statement
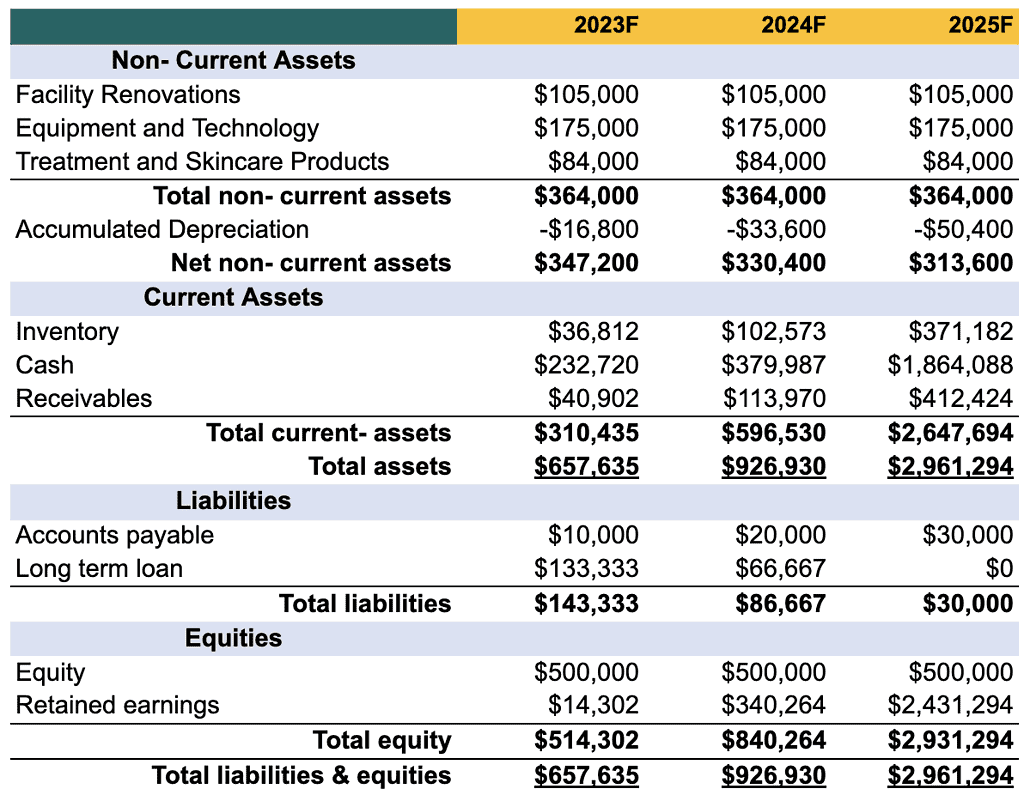
Balance Sheet
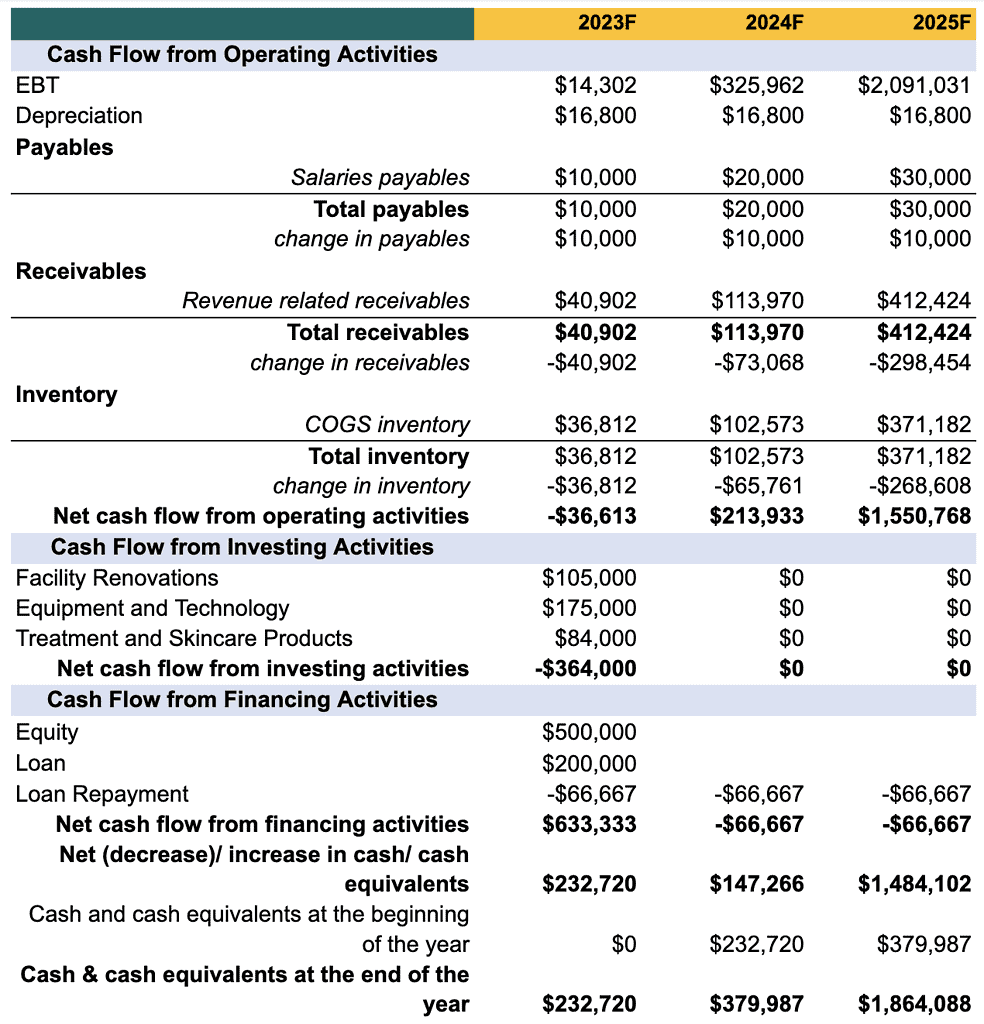
Cash Flow Statement
Relevant Links:
Small Business Grant for Business Owners in 2024
Business Registration Complete Process in USA
How to Avoid a Business Failure: Create a Successful Business

