Written by Elma Steven | Updated on January, 2024
Executive Summary
Overview: Motivatit Seafoods, a pioneer in oyster cultivation and processing since 1971, is a market leader. We provide fresh and frozen oysters, as well as bespoke packaging. We are strongly committed to giving you the quality and consistency you deserve via the brands we’ve created. Motivatit Seafoods have harvested, processed, and delivered oysters to various markets. When you’re in the New Orleans region, come down to Houma (about an hour away) and let us serve you oysters picked from the same reefs that our forefathers have been harvesting for almost 250 years.
Mission: To set the benchmark for oyster farming and processing by using excellent manufacturing methods and adhering to the highest degree of food safety compliance to please clients with dependable service and deliver a healthy, quality product.”
Vision: “To provide a healthy, secured, and safe environment for oyster harvesting and processing and educate fans about the advantages of eating oysters.”
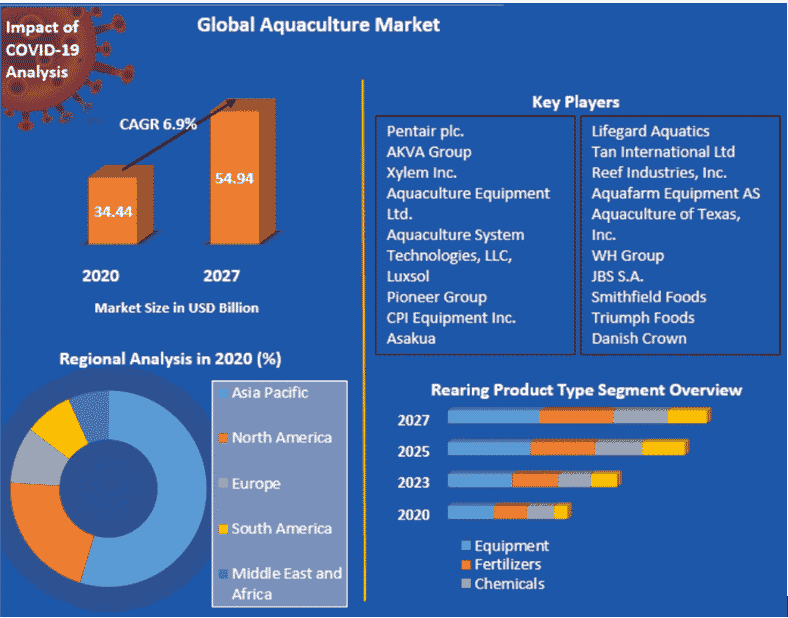
Industry Overview: The global aquaculture market was worth USD 32.22 billion in 2019 and is predicted from 2020 to 2027 to rise at a CAGR of 6.9%, reaching USD 54.95 billion. Includes a detailed analysis of the COVID 19 pandemic’s influence on the global aquaculture market by region, the revenue impact on major companies through April 2020, and the market’s predicted short- and long-term effects.
Financial Overview
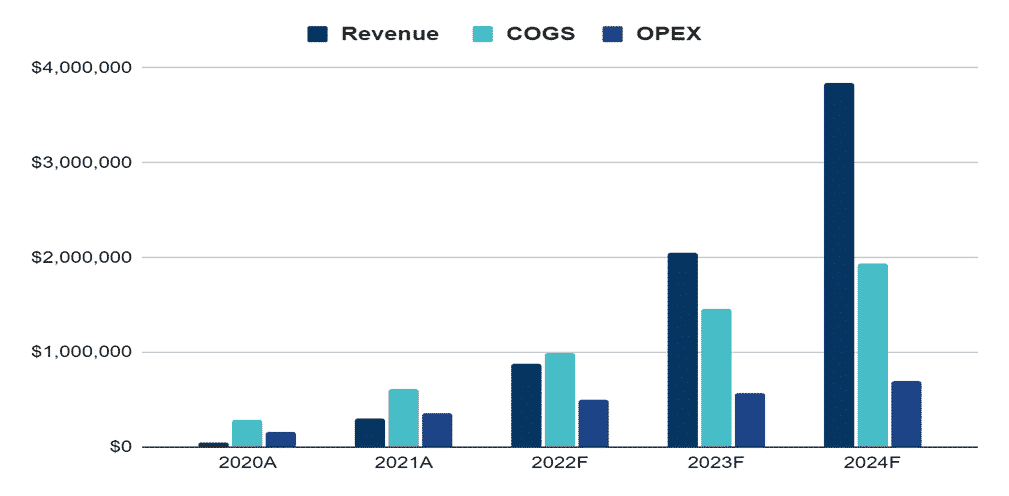
Financials is one of the most important sections of a Oyster Farming business plan. You can get an idea of your projected revenue, required investment amount, is the business sustainable without additional funding, etc.
Financial Highlights:
| Liquidity | 2020A | 2021A | 2022F | 2023F | 2024F |
| Current ratio | 6 | 12 | 23 | 32 | 42 |
| Quick ratio | 6 | 11 | 22 | 31 | 40 |
| DSO | 8 | 8 | 8 | 8 | 8 |
| Solvency | |||||
| Interest coverage ratio | 8.2 | 11.1 | 14.2 | ||
| Debt to asset ratio | 0.01 | 0.01 | 0.2 | 0.18 | 0.16 |
| Profitability | |||||
| Gross profit margin | 51% | 51% | 53% | 53% | 53% |
| EBITDA margin | 12% | 14% | 21% | 22% | 22% |
| Return on asset | 5% | 6% | 13% | 14% | 14% |
| Return on equity | 5% | 6% | 16% | 17% | 17% |
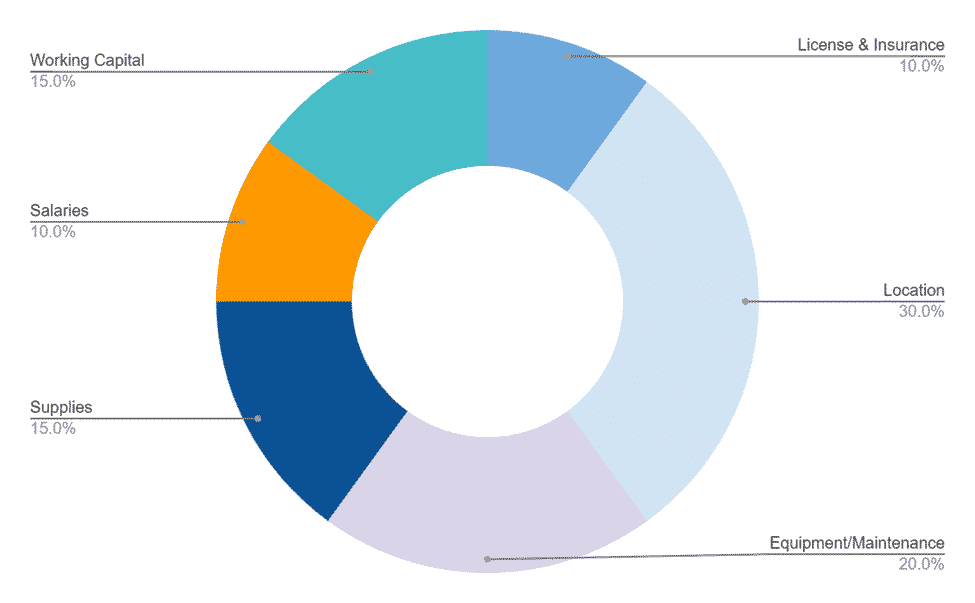
FUND USAGE
Industry Analysis
The industry analysis section of the Oyster Farming business plan will help you get better insights into competitors, market growth, and overall industry prospects. You can order a custom market research report for your Oyster Farming business.
Many people see oysters as a clump of oddly shaped, rock-like things that grow on or near the seabed. According to FAO estimates, global oyster aquaculture output topped wild catches for the first time in 1952, with 306,930 and 302,526 tones, respectively. Since then, aquaculture output has continuously outstripped wild oyster harvests, with 6,125,606 tonnes produced in 2019 vs. 133,984 tones collected wild. Traditional cultivation techniques depended on the natural placement of wild larvae on appropriate benthic substrates (which continues to be the case in many locations). However, alternative methods for growing oysters may provide substantially higher yields.
Trays, baskets, cages, or hanging lines/ropes hung from floats or rafts are used in off-the-bottom oyster production. This method provides more natural food availability while avoiding numerous fouling organisms and predators. Fouling organisms still exist in off-bottom culture, but one solution is to expose oysters to the air on a regular basis (weekly or biweekly) to prevent fouling organisms from growing and surviving. In contrast, oysters seal their shells and wait patiently to be re-submerged.
Over the previous half-decade, the Fish and Seafood Aquaculture sector, including the oyster farming industry, has seen moderate development. This is because the great bulk of the industry’s income comes from the sale of fish, crustaceans, and mollusks processed into food items; the industry’s profitability is directly proportional to the degree of seafood consumption. Oyster farming is one of the oldest types of aquaculture, with oyster farms worldwide. Oyster aquaculture productivity has exploded in recent decades, much like the rest of aquaculture.
The global aquaculture market is divided into segments based on raising product, culture, species, product, and region. Equipment dominated the worldwide market by product type in 2019 and is predicted to continue during the forecast period. These tools are necessary for the growth of aquatic plants and animals. The need for such technology is predicted to increase as the demand for seafood increases and the amount of caught fish decreases. Freshwater represented 46.87 percent of the market in 2019 and is likely to maintain its dominance during the projection period, thanks to ponds, concrete raceways, and cages that mimic freshwater ecosystems. Salmon, oysters, shrimp, and mussels are examples of marine water aquaculture. Sea ranching, intense aquaculture, and rack & line farming are marine aquaculture techniques. The kind of shellfish or fish to be grown determines which procedures should be used. Carp is predicted to be the most popular commodity worldwide during the next several years. Carps are often produced in freshwater environments and are among the most popular aquatic species in this industry due to their adaptability to less-than-ideal environmental circumstances.
While working on the industry analysis section of the Oyster Farming business plan make sure that you add significant number of stats to support your claims and use proper referencing so that your lender can validate the data.
APAC held 41.34 percent of the market share and is expected to maintain its domination in 2019 over the forecast period, owing to rising demand for advanced and cutting-edge aquaculture products that help farmers produce higher-quality output with less land and improve the efficiency of aquaculture operations. China is the region’s largest market, with low labor costs, favorable weather conditions, and abundant natural resources. Furthermore, factors such as technological advancements in this area and advancements in cultivation per regional climatic conditions are projected to generate profitable prospects for the market in this region. North America and Europe are next, followed by APAC.
Global Aquaculture Market 2018-2022 | USD 43.97 Billion in 5-Year Incremental Growth During the forecast period, the global aquaculture market is expected to develop at more than 4% CAGR. One of the prominent trends in the global aquaculture market in 2018-2022 is a rising demand for organic aquaculture. Vendors in the aquaculture sector are focusing on introducing organic aquaculture in response to rising health and environmental concerns. Emerging economies like Indonesia and China are leading the way in organic aquaculture.
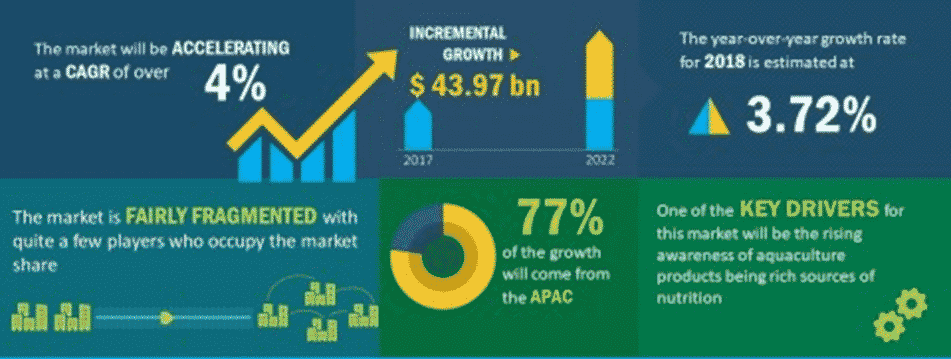
Women and children are increasingly deficient in micronutrients, necessitating the use of nutrient-dense meals. This is driving up demand for aquaculture goods, which are high in nutrients that aid brain growth and reproduction and prevent numerous ailments. As a result, increased consumer awareness of the nutritional value of aquaculture products will drive market expansion throughout the projected period. End-users (commercial and residential), development (freshwater fish, crustaceans, mollusks, diadromous fish, and others), environment (freshwater, marine water, and brackish water), culture (net-pen culture, floating-cage culture, pond culture, and rice field culture), and geography are all covered in the global aquaculture market research report (the Americas, APAC, and EMEA). It examines the market’s primary drivers, opportunities, trends, and industry-specific issues. In 2017, the APAC region accounted for almost 47% of the market, followed by the Americas and EMEA. Although the APAC region will continue to have the most significant market share, the Americas is predicted to grow at a hasty rate during the forecast period.
Marketing Plan
A key part of the marketing plan in a Oyster Farming business plan is the marketing budget. The growth in the number of customers is proportional to the budget and dependent on the CAC.

Discounts: Motivatit Seafoods offers discounts to bulk customers like retailers and restaurants to make our name known around the area.
Endorsements: Motivatit Seafoods will be asking some celebrities and prominent local figures to endorse our product.
Brochures: Sending introductory letters to stakeholders in households, restaurants, and hotels alongside the Motivatit Seafoods brochure.
Social Media: Motivatit Seafoods will promote our products through social media platforms.
Referrals: Motivatit Seafoods products will spread through word of mouth.
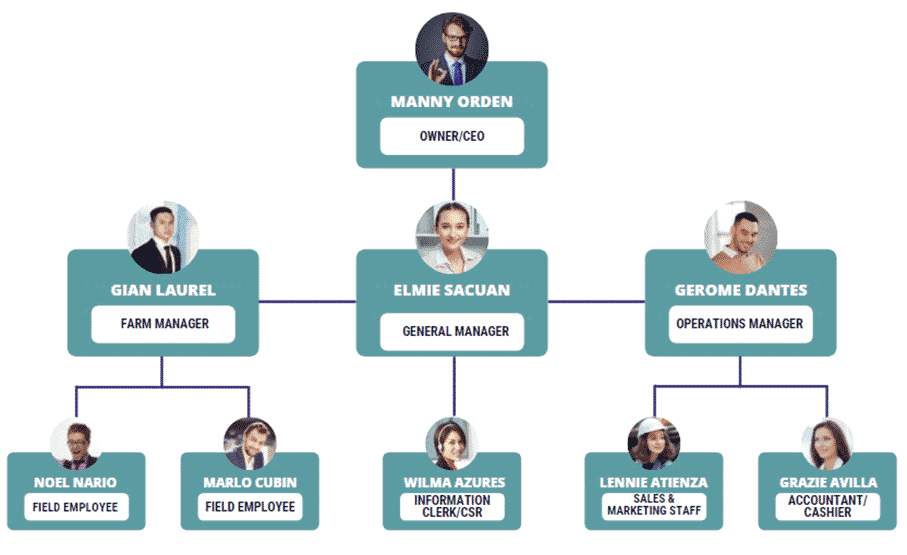
Organogram:
Financial Plan
This section of the Oyster Farming business plan helps your lender figure out whether you will be able to pay off the loan, whether the business is sustainable, what are the growth prospects, etc.
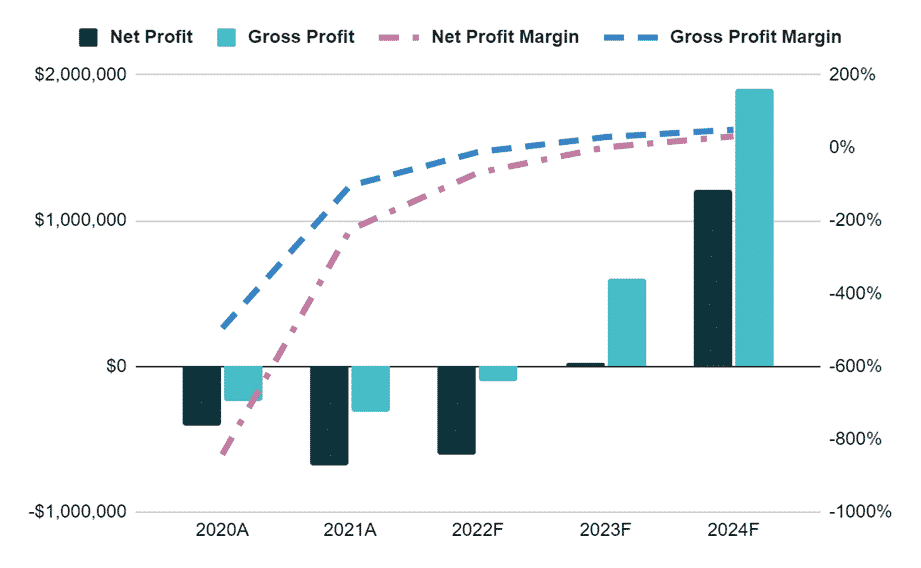
Earnings:
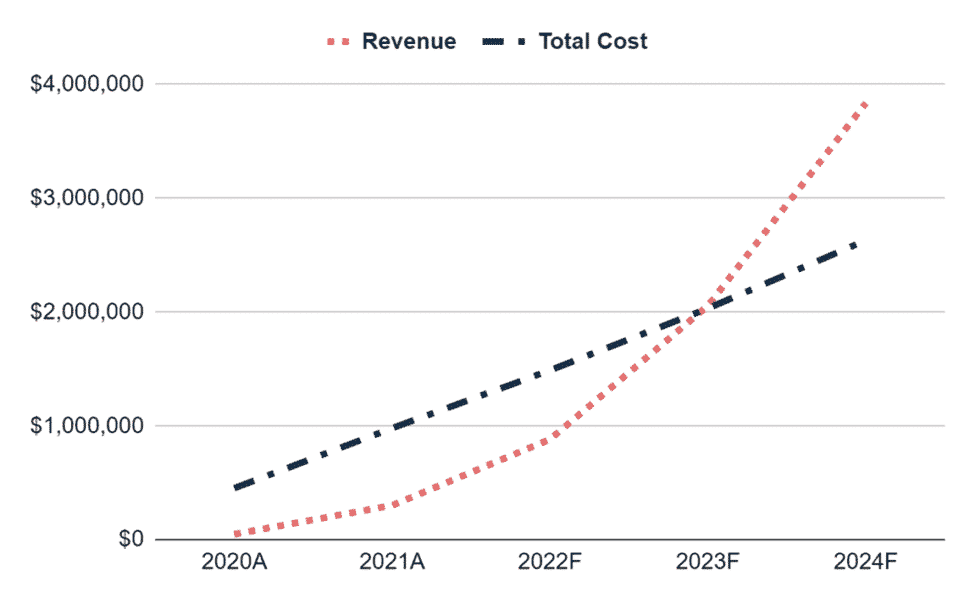
Break-Even Analysis:
Income Statement:
| 2020A | 2021A | 2022F | 2023F | 2024F | |
| ANNUAL REVENUE | |||||
| Item 1 | 9,217 | 59,117 | 175,410 | 415,277 | 781,357 |
| Item 2 | 34,701 | 222,558 | 660,368 | 1,563,394 | 2,941,580 |
| Item 3 | 4,067 | 19,561 | 46,432 | 78,519 | 114,905 |
| Total annual revenue | 47,985 | 301,236 | 882,211 | 2,057,189 | 3,837,842 |
| % increase | 528% | 193% | 133% | 87% | |
| COST of REVENUE | |||||
| Item 1 | 360 | 2,259 | 6,617 | 15,429 | 28,784 |
| Item 2 | 480 | 3,012 | 8,822 | 20,572 | 38,378 |
| Item 3 | 52,000 | 65,000 | 78,000 | 91,000 | 104,000 |
| Item 4 | 720 | 3,615 | 8,822 | 16,458 | 23,027 |
| Item 5 | 140,000 | 336,000 | 560,000 | 840,000 | 1,120,000 |
| Item 6 | 60,000 | 144,000 | 240,000 | 360,000 | 480,000 |
| Item 7 | 32,000 | 61,333 | 85,533 | 112,153 | 141,435 |
| Total Cost of Revenue | 285,560 | 615,220 | 987,794 | 1,455,612 | 1,935,625 |
| as % of revenue | 595% | 204% | 112% | 71% | 50% |
| Gross Profit | -237,575 | -313,984 | -105,583 | 601,578 | 1,902,218 |
| SELLING & ADMIN EXPENSES | |||||
| Item 1 | 28,000 | 96,800 | 154,880 | 175,692 | 193,261 |
| Item 2 | 75,000 | 105,000 | 120,000 | 120,000 | 120,000 |
| Item 3 | 36,000 | 96,000 | 108,000 | 120,000 | 120,000 |
| Item 4 | 8,000 | 12,000 | 12,000 | 12,000 | 12,000 |
| Item 5 | 3,839 | 18,074 | 44,111 | 61,716 | 115,135 |
| Item 6 | 3,359 | 12,049 | 26,466 | 41,144 | 76,757 |
| Item 7 | 5,600 | 10,000 | 12,904 | 15,034 | 17,376 |
| Item 8 | 6,667 | 14,000 | 22,067 | 30,940 | 40,701 |
| Total selling & admin expenses | 166,464 | 363,924 | 500,428 | 576,525 | 695,230 |
| as % of revenue | 347% | 121% | 57% | 28% | 18% |
| Net profit | -404,039 | -677,907 | -606,011 | 25,052 | 1,206,987 |
| Accumulated net profit | -404,039 | -1,081,947 | -1,687,957 | -1,662,905 | -455,918 |
Cash Flow Statement:
| 2020A | 2021A | 2022F | 2023F | 2024F | |
| CASH FLOW from OPERATING ACTIVITIES | |||||
| Net profit before tax | -$404,039 | -$677,907 | -$606,011 | $25,052 | $1,206,987 |
| Depreciation | $44,267 | $85,333 | $120,504 | $158,127 | $199,512 |
| Payables | |||||
| Item 1 | $4,333 | $5,417 | $6,500 | $7,583 | $8,667 |
| Item 2 | $11,667 | $28,000 | $46,667 | $70,000 | $93,333 |
| Item 3 | $6,250 | $8,750 | $10,000 | $10,000 | $10,000 |
| Item 4 | $3,000 | $8,000 | $9,000 | $10,000 | $10,000 |
| Item 5 | $667 | $1,000 | $1,000 | $1,000 | $1,000 |
| Total payables | $25,917 | $51,167 | $73,167 | $98,583 | $123,000 |
| change in payables | $25,917 | $25,250 | $22,000 | $25,417 | $24,417 |
| Receivables | |||||
| Item 1 | $320 | $1,506 | $3,676 | $5,143 | $9,595 |
| Item 2 | $360 | $1,807 | $4,411 | $8,229 | $11,514 |
| Total receivables | $680 | $3,314 | $8,087 | $13,372 | $21,108 |
| change in receivables | -$680 | -$2,634 | -$4,773 | -$5,285 | -$7,736 |
| Net cash flow from operating activities | -$334,536 | -$569,958 | -$468,280 | $203,311 | $1,423,180 |
| CASH FLOW from INVESTING ACTIVITIES | |||||
| Item 1 | $16,000 | $13,200 | $14,520 | $15,972 | $17,569 |
| Item 2 | $20,000 | $22,000 | $24,200 | $26,620 | $29,282 |
| Item 3 | $28,000 | $22,000 | $14,520 | $10,648 | $11,713 |
| Item 4 | $96,000 | $88,000 | $72,600 | $79,860 | $87,846 |
| Item 5 | $20,000 | $22,000 | $24,200 | $26,620 | $29,282 |
| Net cash flow/ (outflow) from investing activities | -$180,000 | -$167,200 | -$150,040 | -$159,720 | -$175,692 |
| CASH FLOW from FINANCING ACTIVITIES | |||||
| Equity | $400,000 | $440,000 | $484,000 | $532,400 | $585,640 |
| Net cash flow from financing activities | $400,000 | $440,000 | $484,000 | $532,400 | $585,640 |
| Net (decrease)/ increase in cash/ cash equivalents | -$114,536 | -$297,158 | -$134,320 | $575,991 | $1,833,128 |
| Cash and cash equivalents at the beginning of the year | – | -$114,536 | -$411,693 | -$546,014 | $29,978 |
| Cash & cash equivalents at the end of the year | -$114,536 | -$411,693 | -$546,014 | $29,978 | $1,863,105 |
Balance Sheet:
| 2020A | 2021A | 2022F | 2023F | 2024F | |
| NON-CURRENT ASSETS | |||||
| Item 1 | $16,000 | $29,200 | $43,720 | $59,692 | $77,261 |
| Item 2 | $20,000 | $42,000 | $66,200 | $92,820 | $122,102 |
| Item 3 | $28,000 | $50,000 | $64,520 | $75,168 | $86,881 |
| Item 4 | $96,000 | $184,000 | $256,600 | $336,460 | $424,306 |
| Item 5 | $20,000 | $42,000 | $66,200 | $92,820 | $122,102 |
| Total | $180,000 | $347,200 | $497,240 | $656,960 | $832,652 |
| Accumulated depreciation | $44,267 | $129,600 | $250,104 | $408,231 | $607,743 |
| Net non-current assets | $135,733 | $217,600 | $247,136 | $248,729 | $224,909 |
| CURRENT ASSETS | |||||
| Cash | -$114,536 | -$411,693 | -$546,014 | $29,978 | $1,863,105 |
| Accounts receivables | $680 | $3,314 | $8,087 | $13,372 | $21,108 |
| Total current assets | -$113,856 | -$408,380 | -$537,927 | $43,349 | $1,884,214 |
| Total Assets | $21,878 | -$190,780 | -$290,791 | $292,078 | $2,109,122 |
| LIABILITIES | |||||
| Account payables | $25,917 | $51,167 | $73,167 | $98,583 | $123,000 |
| Total liabilities | $25,917 | $51,167 | $73,167 | $98,583 | $123,000 |
| EQUITIES | |||||
| Owner’s equity | $400,000 | $840,000 | $1,324,000 | $1,856,400 | $2,442,040 |
| Accumulated net profit | -$404,039 | -$1,081,947 | -$1,687,957 | -$1,662,905 | -$455,918 |
| Total equities | -$4,039 | -$241,947 | -$363,957 | $193,495 | $1,986,122 |
| Total liabilities & equities | $21,878 | -$190,780 | -$290,791 | $292,078 | $2,109,122 |
