Written by Elma Steven | Updated on April, 2024

How to Write a Self Storage Business Plan?
Self Storage Business Plan is an outline of your overall Self Storage business. The business plan includes a 5 year projection, marketing plan, industry analysis, organizational overview, operational overview and finally the executive summary. Remember to write your executive summary at the end as it is considered as a snapshot of the overall business plan. The creation of a plan requires careful consideration of various factors that might impact the business’s success.
Executive Summary
We at SecureSpace provide a wide range of facilities and services to meet all of your storage requirements. Florida City is the entrance to the Florida Keys and is a great place to start various experiences. To assist you in entirely using your outdoor chances, we provide a variety of storage alternatives. Key Largo, Ocean Reef, and other nearby areas may use us as a handy storage alternative if they are in the Florida Keys region. There is no question that self-storage facilities are a considerable aid to both homes and enterprises, whether for commercial purposes or remodeling, moving out, storing a loved one’s things, or other reasons.
Problem Summary: The demand for self-storage facilities has been increasing rapidly in recent years, driven by factors such as urbanization, population growth, downsizing, and the rise of e-commerce. However, there is a lack of modern and secure self-storage facilities that provide customers with a hassle-free experience. Many of the existing facilities are outdated, unappealing, and fail to meet the expectations of today’s customers, who demand easy access, climate-controlled units, and advanced security features.
Solution Summary: SecureSpace is a state-of-the-art self-storage facility that aims to fill the gap in the market by providing modern, secure, and customer-focused storage solutions. We offer a wide range of unit sizes, including climate-controlled units, and our facility is equipped with advanced security features such as 24/7 surveillance, access control systems, and individual unit alarms. Our customers will have the option to access their units at any time of the day or night, and our friendly and knowledgeable staff will be on hand to assist them with any queries or concerns.
Industry Overview: The self-storage industry has experienced steady growth over the past decade, with a compound annual growth rate (CAGR) of 7.6% between 2016 and 2021. In 2021, the industry generated $44.7 billion in revenue, and there were approximately 59,500 self-storage facilities in the US. The industry is expected to continue growing at a CAGR of 6.6% between 2021 and 2026, driven by factors such as urbanization, population growth, and the increasing demand for e-commerce. However, the industry is also becoming more competitive, with many new players entering the market and existing players upgrading their facilities to meet the changing demands of customers. Check out this guide on how to write an executive summary? If you don’t have the time to write on then you can use this custom Executive Summary Writer to save Hrs. of your precious time.
Financial Overview:
Source: ibisworld
Business Description
Business Name: SecureSpace
Founder: Jacob Harrison
Management Team:

Legal Structure: LLC
Location: 1234 Main St, Bellevue, WA 98004
Mission: “Our mission is to provide a modern and secure self-storage facility with a focus on exceptional customer service. We aim to ensure that our clients’ possessions are kept safe and secure while offering convenience, flexibility, and affordability.”
Vision: “Our vision is to become the leading self-storage provider in the area, known for our state-of-the-art facilities, exceptional customer service, and commitment to meeting the evolving needs of our clients.”
Goals:
- Achieving and maintaining high occupancy rates
- Providing exceptional customer service and ensuring customer satisfaction
- Continuously upgrading our facilities to meet the changing demands of our clients
- Expanding our reach through targeted marketing efforts
- Establishing SecureSpace as a trusted and reliable provider of self-storage solutions
Products:
Our primary product at SecureSpace is secure and convenient self-storage units of various sizes, including climate-controlled units. Our facilities are equipped with advanced security features such as 24/7 surveillance, access control systems, and individual unit alarms to ensure the safety of our clients’ possessions. In addition, we offer flexible lease options, including short-term and long-term leases, to accommodate the varying needs of our clients. We also provide exceptional customer service, with knowledgeable and friendly staff on hand to assist our clients with any queries or concerns.
Financial Overview
Fund Usage Plan
Source: harriswilliams
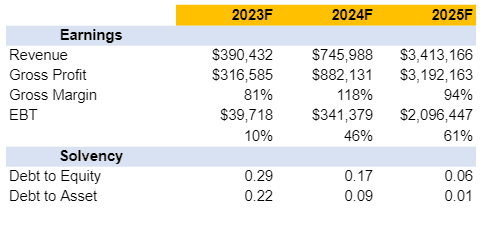
Key Metrics
Business Model
Check out 100 samples of business model canvas.


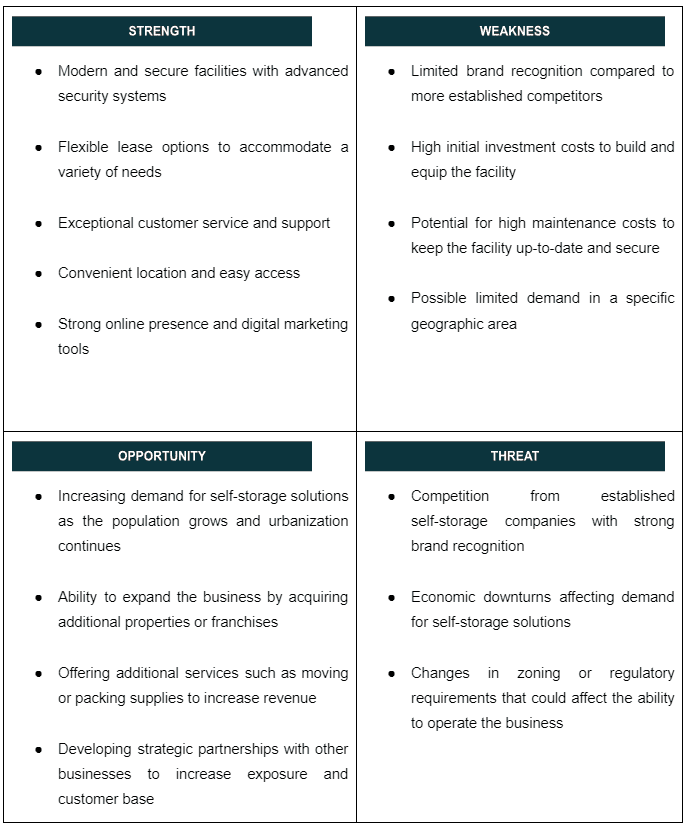
SWOT ANALYSIS
it offers a clear lens into a company’s strengths, weaknesses, opportunities, and threats. This self-awareness enables effective resource allocation and strategic positioning against competitors. Businesses can mitigate risks, make informed decisions, and set realistic goals. In addition, presenting a SWOT analysis in a business plan communicates to stakeholders that the company possesses a deep understanding of its market environment. In essence, SWOT ensures a business’s strategy is grounded in reality enhancing its chances of success. Check out the 100 SWOT samples which will give you a better idea on SWOT writing process.

Organizational Overview
Founder
Jacob Harrison
Founder/ CEO/ Jacob Harrison
Hi there! My name is Jacob Harrison and I am the founder and CEO of SecureSpace, a modern and secure self-storage facility with a focus on exceptional customer service. I have over 10 years of experience in the real estate industry, with a specific focus on property management and development.
Prior to founding SecureSpace, I worked as a property manager for several large commercial real estate firms, where I gained valuable experience in facility management, tenant relations, and leasing. I recognized a need for a modern, secure, and customer-focused self-storage solution, which led me to start SecureSpace.
I am a driven and innovative entrepreneur who is dedicated to providing the best possible self-storage experience for my clients. I am passionate about meeting the evolving needs of my clients and staying ahead of industry trends to ensure SecureSpace remains a leader in the field.
I hold a Bachelor’s degree in Business Administration from the University of California, Los Angeles (UCLA) and a Master’s degree in Real Estate Development from the University of Southern California (USC). I am a member of several industry organizations and am committed to staying up-to-date on the latest developments in the real estate and self-storage industries.
Organogram

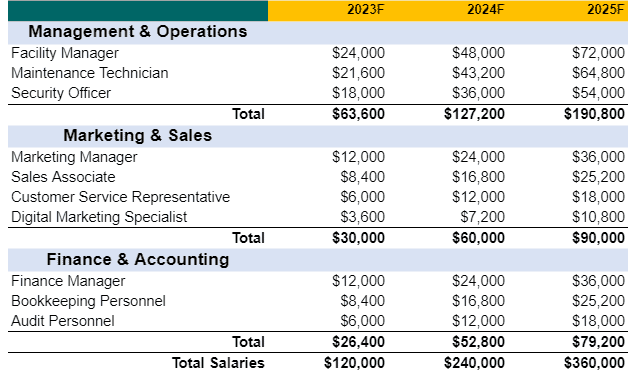
Salaries
Management & Operations:
Marketing & Sales:
Finance & Accounting:
Industry Analysis
Industry Problems
- Limited availability of modern and secure self-storage facilities in certain geographic areas
- Perceived lack of customer service and support in some self-storage facilities
- Increasing competition from established and new players in the industry
- Vulnerability to economic downturns affecting demand for self-storage solutions
- Limited flexibility in lease options and contract terms
Industry Opportunities
- Increasing demand for self-storage solutions as the population grows and urbanization continues
- Ability to expand the business by acquiring additional properties or franchises
- Offering additional services such as moving or packing supplies to increase revenue
- Developing strategic partnerships with other businesses to increase exposure and customer base
- Incorporating new technologies such as online booking and smart security systems to improve efficiency and security
Market Segmentation
- Demographic Segmentation:
- Homeowners in need of storage solutions during home renovations or downsizing
- College students in need of temporary storage during breaks
- Individuals and families in the process of moving or relocating
- Businesses in need of storage space for inventory or equipment
- Travelers in need of secure storage solutions for personal belongings
- Psychographic Segmentation:
- Busy professionals who value convenience and ease of use
- Environmentalists who prefer eco-friendly storage solutions
- Minimalists who value simplicity and minimalism in their lives
- Tech-savvy individuals who prefer the latest technology in their storage solutions
- Safety-conscious individuals who prioritize the security of their possessions
- Behavioral Segmentation:
- Short-term renters who require temporary storage solutions
- Long-term renters who require extended storage solutions
- Frequent renters who require regular storage solutions
- Large item renters who require storage solutions for bulky items such as vehicles or boats
- Budget-conscious renters who prioritize affordability in their storage solutions
Market Size
Marketing Plan
Marketing Budget
Marketing Objectives
- Boost brand awareness: Increase recognition and recall by 20% within 12 months using targeted campaigns and social media.
- Grow market share: Expand market share by 10% in two years with innovative products and new segments.
- Retain customers: Raise repeat customer rate by 15% within a year through personalization, loyalty programs, and customer support.
- Enhance online presence: Increase website traffic by 25% and social media followers by 30% in 18 months using engaging content and SEO.
- Increase sales revenue: Achieve a 20% revenue growth in the next financial year with promotional strategies and product expansion.
- Strengthen brand loyalty: Improve net promoter score (NPS) by 10 points in 12 months by focusing on customer satisfaction and loyalty benefits.
- Promote sustainability: Increase eco-friendly products by 30% in two years to appeal to environmentally conscious consumers.
- Improve customer engagement: Boost email open rates by 20% and click-through rates by 15% in a year with targeted email campaigns.
- Enter new markets: Launch products in two international markets within 24 months using market research and strategic partnerships.
- Enhance product positioning: Raise top-of-mind awareness as a leader in comfort and innovation within 18 months through marketing and product innovation.
Go-to-Market (GTM) Strategy
- Social Media Marketing:
a. Create and share engaging content that reflects the brand’s values and showcases products.
b. Collaborate with influencers who resonate with your target audience to increase reach and brand awareness.
c. Utilize paid advertising campaigns on platforms like Instagram, Facebook, and Pinterest to target specific customer segments.
d. Engage with followers, respond to comments, and address customer inquiries to strengthen customer relationships and loyalty.
- Content Marketing:
a. Develop a blog on the brand’s website featuring educational and informative content about undergarments, trends, and styling tips.
b. Leverage video content on platforms like YouTube to showcase products, share tutorials, and engage with customers.
c. Create infographics or visually appealing content to share on social media platforms and drive website traffic.
- Email Marketing:
a. Build and segment email lists based on customer behavior, preferences, and demographics.
b. Send personalized email campaigns with targeted offers, promotions, and relevant content.
c. Utilize automation tools to nurture leads and encourage repeat purchases.
- Public Relations:
a. Develop press releases and media kits to promote product launches, collaborations, or brand milestones.
b. Cultivate relationships with industry journalists and bloggers to secure coverage in relevant publications.
c. Participate in industry events, trade shows, and fashion weeks to increase brand visibility and networking opportunities.
- Search Engine Marketing (SEM) and Search Engine Optimization (SEO):
a. Optimize website content and structure to improve organic search ranking on search engines like Google.
b. Utilize keyword research and on-page optimization to target relevant search queries.
c. Implement paid search campaigns (Google Ads) to capture high-intent search traffic and drive conversions.
- Affiliate and Influencer Marketing:
a. Develop an affiliate program to incentivize bloggers, influencers, and content creators to promote the brand and products in exchange for a commission on sales.
b. Collaborate with influencers on content creation, product reviews, and giveaways to generate buzz and increase brand exposure.
- Offline Advertising and Promotions:
a. Place ads in print magazines, newspapers, or on billboards that cater to your target audience.
b. Host in-store events, pop-up shops, or fashion shows to create memorable experiences and connect with customers.
Budget allocation across channels:
Financials
Earnings
Liquidity
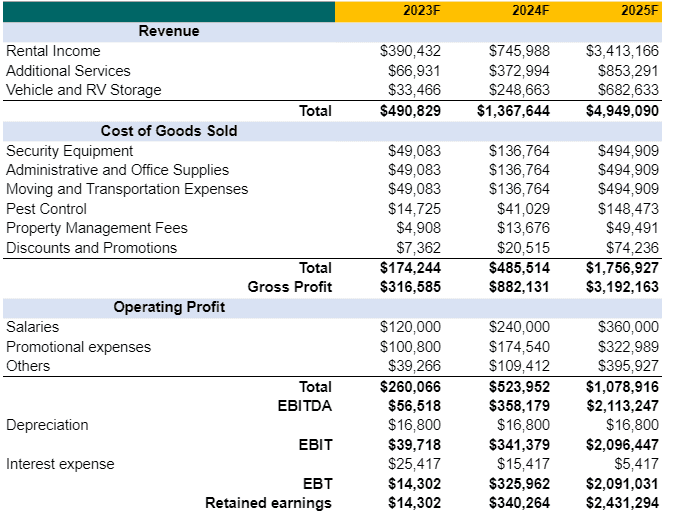
Income Statement
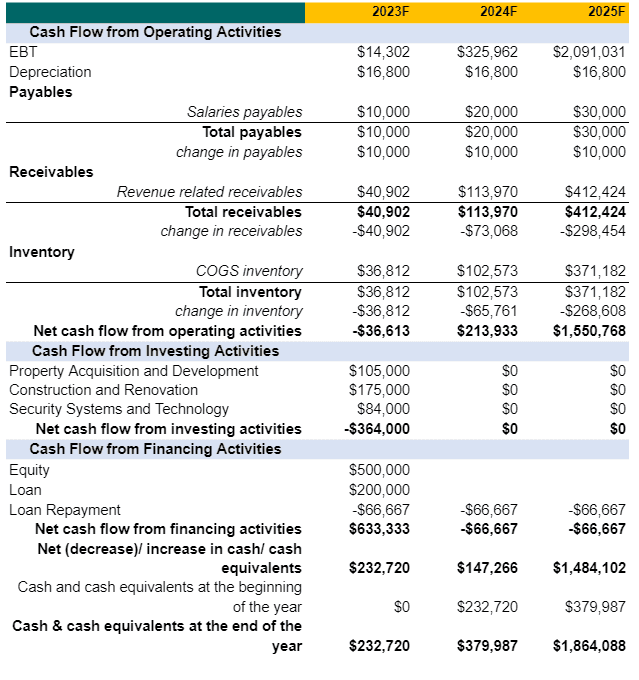
Cash Flow Statement
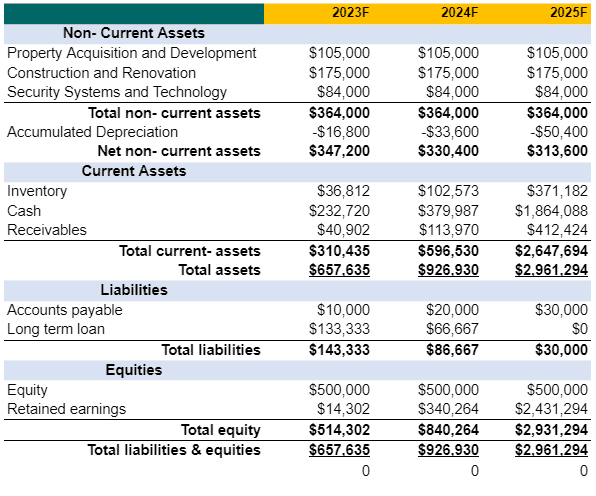
Balance Sheet
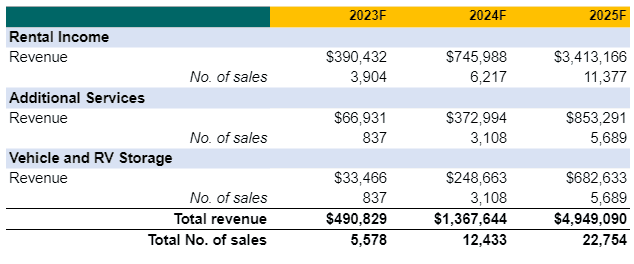
Revenue Summary
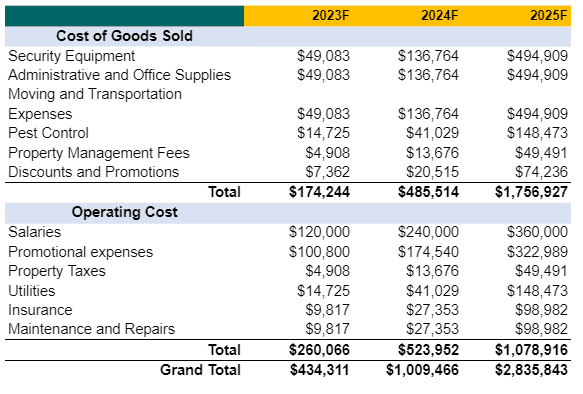
Cost Summary
Salaries
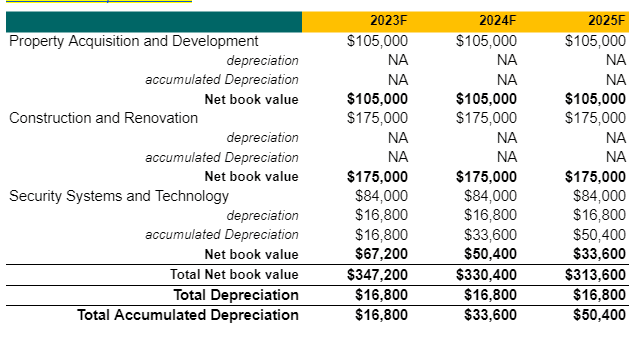
Non- Current Asset Schedule
