Written by Elma Steven | Updated on April, 2024
How to Write a Thrift Store Business Plan?
Thrift Store Business Plan is an outline of your overall thrift store business. The business plan should includes a 5 year financial projection, marketing plan, industry analysis, organizational overview, operational overview and finally an executive summary. Remember to write your executive summary at the end as it is considered as a snapshot of the overall business plan. You need to be careful while writing the plan as you need to consider various factors that can impact the business’s success.
Table of Contents
Executive Summary
Overview: [Thrift store name] is a revolutionary thrift store aiming to transform the shopping experience for consumers who are seeking affordable, stylish and high-quality pre-owned items. It is located in [location] and was founded by [founder] during [year of establishment]. As a socially responsible business, we are committed to giving back to the community by reducing waste, promoting sustainable shopping habits, and providing job opportunities for the underprivileged.
Problem Summary: The global fashion industry produces 92 million tons of waste annually, with clothing consumption expected to rise by 63% by 2030. The fast fashion trend has led to increased clothing disposal rates, overwhelming landfills and negatively impacting the environment. Additionally, low-income families struggle to afford fashionable and quality clothing, which limits their ability to express themselves and feel confident.
Solution Summary: Bargain Bonanza addresses these issues by offering a curated selection of gently used, high-quality, and fashionable clothing at affordable prices. Our store provides an eco-friendly shopping alternative that reduces the environmental impact of fast fashion and extends the lifecycle of garments. By collaborating with local non-profit organizations and offering vocational training, we will also create job opportunities for disadvantaged individuals and support the local community.
Industry Overview: The global second-hand clothing market was valued at $32 billion in 2020 and is projected to reach $51 billion by 2023, growing at a CAGR of 11% from 2018 to 2023 (source: GlobalData). The US thrift store industry alone generates approximately $10.5 billion in annual revenue (source: IBISWorld). This growth is driven by increasing environmental awareness, consumer preference for unique and vintage styles, and the desire for affordable clothing options. The industry is characterized by a mix of small, local stores and large-scale chain operations such as Goodwill and The Salvation Army, creating a diverse and competitive market landscape. Check out this guide on how to write an executive summary? If you don’t have the time to write on then you can use this custom Executive Summary Writer to save Hrs. of your precious time.
Financial Overview: Click here for Updated Chart
Business Description
Business Name: Bargain Bonanza
Founder: Jacob Harrison
Management Team:

Legal Structure: LLC
Location: 1234 Main St, Bellevue, WA 98004
Mission: “To provide a sustainable, affordable, and fashionable shopping experience that fosters community growth and environmental responsibility.”
Vision: “To become a leading thrift store chain recognized for its commitment to social and environmental impact, while empowering customers to make responsible and stylish choices.”
Goals:
- Environmental Impact: Divert a significant amount of textile waste from landfills by promoting sustainable shopping habits and increasing the lifecycle of clothing items.
- Community Development: Create job opportunities and offer vocational training for disadvantaged individuals, in partnership with local non-profit organizations.
- Customer Satisfaction: Deliver a consistently high-quality, diverse, and stylish selection of pre-owned products that cater to a wide range of consumer preferences.
- Expansion: Establish multiple store locations across the country, fostering a strong brand presence and further promoting sustainable shopping alternatives.
- Financial Success: Achieve profitability within the first three years of operation and maintain steady revenue growth.
Products:
- Clothing: A curated selection of gently used men’s, women’s, and children’s apparel, including shirts, pants, dresses, outerwear, and activewear.
- Accessories: A diverse assortment of bags, belts, hats, scarves, and other fashionable accessories that complement our clothing offerings.
- Shoes: A range of stylish and comfortable footwear for men, women, and children, including sneakers, boots, sandals, and heels.
- Jewelry: Unique and affordable pre-owned jewelry, such as necklaces, bracelets, rings, and earrings.
- Vintage and Collectibles: An exclusive section featuring vintage clothing, memorabilia, and collectible items for enthusiasts and collectors.
- Home Goods: A variety of gently used home décor, kitchenware, and small furniture items that appeal to eco-conscious customers looking to furnish their homes in a sustainable manner.
Financial Overview
Fund Usage
Key Metrics

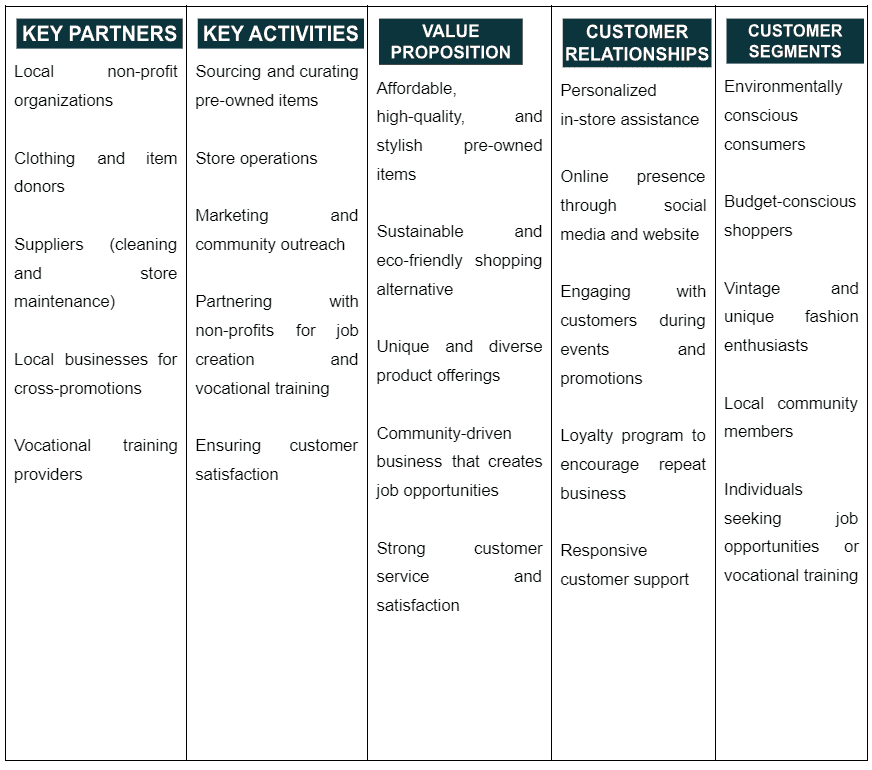
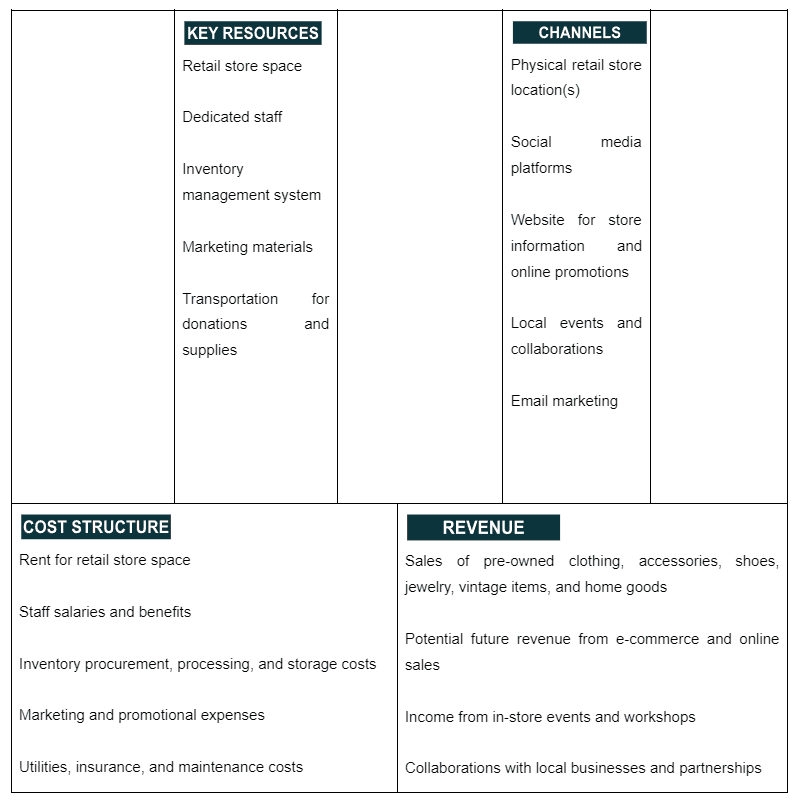
Business Model
Check out 100 samples of business model canvas.
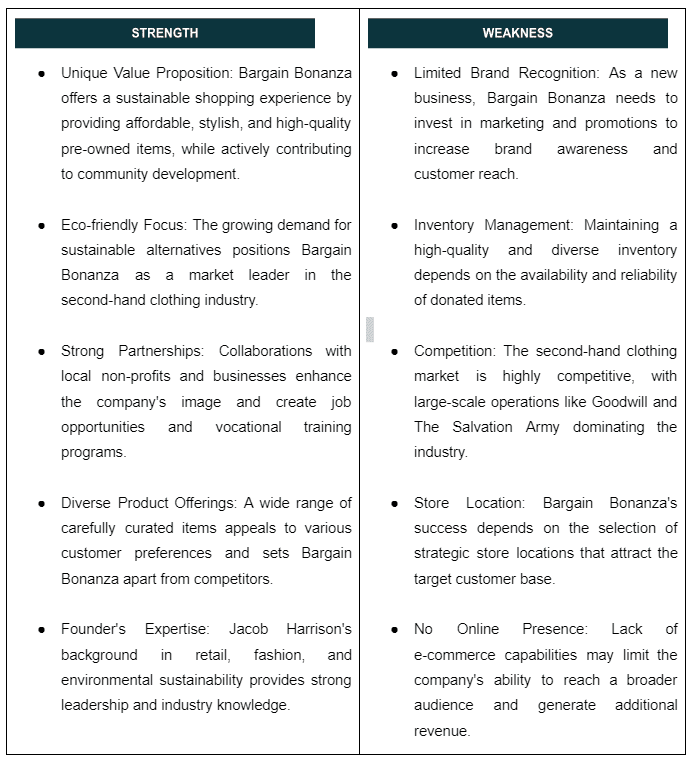
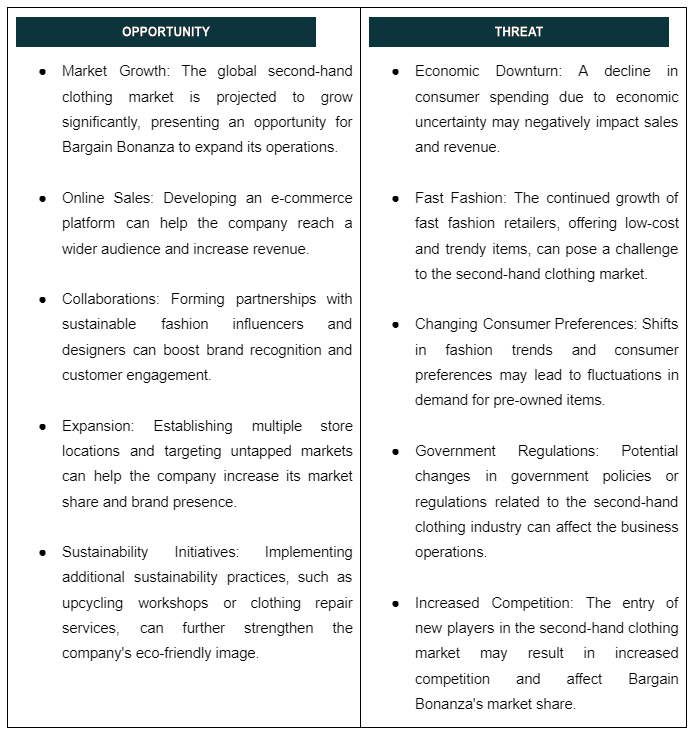
SWOT
Check out the 100 SWOT samples which will give you a better idea on SWOT writing process.
Organizational Overview
Founder
Jacob Harrison
Founder/ CEO/
Hi there! My name is Jacob Harrison and I am the passionate and driven founder of Bargain Bonanza, a thriving thrift store focused on promoting sustainable shopping, providing affordable fashion, and giving back to the community. With over a decade of experience in the retail and fashion industries, I have cultivated a deep understanding of customer needs and market trends, positioning me as an innovative leader in the second-hand clothing market.
I began my career working for a major clothing retailer, where I quickly rose through the ranks and gained invaluable experience in inventory management, merchandising, and sales. This experience ignited my passion for the fashion industry but also exposed me to the environmental and social issues associated with fast fashion.
Determined to make a positive impact, I pursued a degree in Environmental Science from a renowned university, where I specialized in sustainable business practices. Upon graduation, I worked for an environmental consultancy firm, honing my skills in sustainability and corporate social responsibility.
Combining my love for fashion, retail expertise, and commitment to sustainability, I founded Bargain Bonanza in 2023. My vision was to create a business that not only offered affordable and stylish pre-owned items but also promoted eco-friendly shopping habits and contributed to community development.
Under my leadership, Bargain Bonanza has successfully curated a diverse and fashionable inventory that appeals to a wide range of customers. In addition, the store has developed strong partnerships with local non-profit organizations, creating job opportunities and offering vocational training for disadvantaged individuals.
My dedication to environmental responsibility, social impact, and customer satisfaction has set the foundation for Bargain Bonanza’s success and future growth. As the company expands, I remain committed to upholding the core values that have made Bargain Bonanza a beloved and trusted shopping destination for eco-conscious consumers.
Organogram
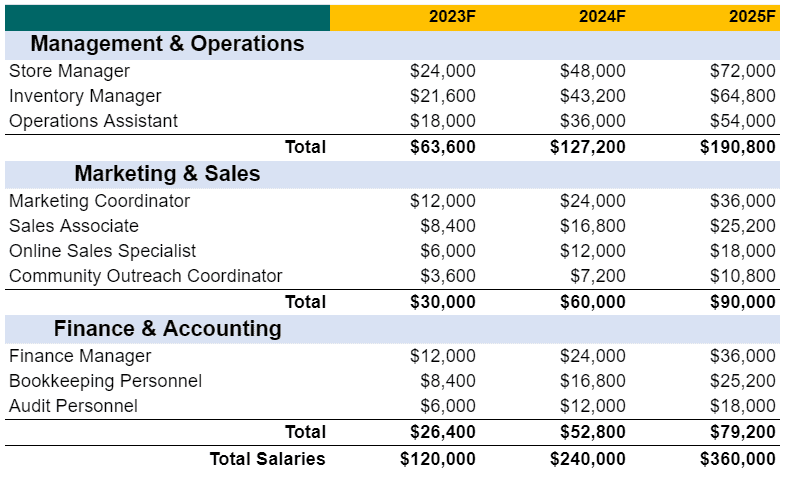
Salaries
Management & Operations:
Marketing & Sales:
Finance & Accounting:
Industry Analysis
Industry Problems
- Environmental Impact: The fast fashion industry contributes to pollution, excessive water consumption, and textile waste in landfills, which raises concerns about sustainability.
- Disposable Clothing Culture: The rapid pace of fashion trends encourages consumers to frequently discard clothing, leading to increased waste and overconsumption.
- Limited Access to Quality Affordable Clothing: Low-income families often struggle to find fashionable and high-quality clothing at affordable prices.
- Inefficient Resource Management: The fashion industry often lacks efficient recycling and upcycling processes, leading to the underutilization of resources.
- Labor Issues: Fast fashion production often involves unethical labor practices, such as low wages and poor working conditions, in developing countries.
Industry Opportunities
- Circular Economy: The growing interest in a circular economy promotes recycling, upcycling, and reusing materials, which can drive innovation and reduce waste in the fashion industry.
- Sustainable Fashion: The demand for sustainable and ethically-produced clothing presents an opportunity for businesses to adopt eco-friendly practices and appeal to environmentally conscious consumers.
- Technology Integration: The use of technology, such as AI and data analytics, can help businesses optimize inventory management, enhance customer experience, and reduce waste.
- Collaborations and Partnerships: Forming strategic partnerships with sustainable fashion influencers, designers, and organizations can boost brand recognition and customer engagement.
- Educational Initiatives: Raising consumer awareness about the environmental and social impacts of fast fashion can encourage sustainable shopping habits and support the growth of the second-hand clothing market.
Market Segmentation
- Demographic Segmentation:
- Age: Targeting various age groups, such as teens, young adults, and adults, who are interested in affordable and sustainable fashion options.
- Gender: Catering to the clothing preferences and needs of both men and women.
- Income: Focusing on low to middle-income individuals who seek affordable, stylish, and quality clothing.
- Family Life Cycle: Providing clothing options for families with children, as they often require budget-friendly and sustainable clothing choices.
- Location: Targeting urban and suburban communities with a higher concentration of environmentally conscious consumers.
- Psychographic Segmentation:
- Values and Beliefs: Catering to customers who prioritize sustainability, ethical production, and reducing their environmental impact.
- Interests and Hobbies: Targeting individuals who enjoy thrift shopping, vintage fashion, and unique clothing styles.
- Lifestyle: Attracting customers who prefer a sustainable and eco-friendly lifestyle, including those who actively recycle, upcycle, and support ethical businesses.
- Behavioral Segmentation:
- Occasion-Based: Offering seasonal and event-specific clothing, such as holiday attire, summer wear, or back-to-school selections.
- Benefits Sought: Catering to customers seeking affordable prices, unique styles, and eco-friendly shopping experiences.
- Usage Rate: Targeting both frequent and occasional thrift shoppers, as well as those new to second-hand shopping.
- Brand Loyalty: Implementing loyalty programs and promotions to encourage repeat business and long-term customer relationships.
- Customer Readiness Stage: Providing education and awareness initiatives to attract potential customers who may be hesitant to explore second-hand clothing options.
Market Size
Marketing Plan
Marketing Budget
Marketing Objectives
- Boost brand awareness: Increase recognition and recall by 20% within 12 months using targeted campaigns and social media.
- Grow market share: Expand market share by 10% in two years with innovative products and new segments.
- Retain customers: Raise repeat customer rate by 15% within a year through personalization, loyalty programs, and customer support.
- Enhance online presence: Increase website traffic by 25% and social media followers by 30% in 18 months using engaging content and SEO.
- Increase sales revenue: Achieve a 20% revenue growth in the next financial year with promotional strategies and product expansion.
- Strengthen brand loyalty: Improve net promoter score (NPS) by 10 points in 12 months by focusing on customer satisfaction and loyalty benefits.
- Promote sustainability: Increase eco-friendly products by 30% in two years to appeal to environmentally conscious consumers.
- Improve customer engagement: Boost email open rates by 20% and click-through rates by 15% in a year with targeted email campaigns.
- Enter new markets: Launch products in two international markets within 24 months using market research and strategic partnerships.
- Enhance product positioning: Raise top-of-mind awareness as a leader in comfort and innovation within 18 months through marketing and product innovation.
Go-to-Market (GTM) Strategy
- Social Media Marketing:
a. Create and share engaging content that reflects the brand’s values and showcases products.
b. Collaborate with influencers who resonate with your target audience to increase reach and brand awareness.
c. Utilize paid advertising campaigns on platforms like Instagram, Facebook, and Pinterest to target specific customer segments.
d. Engage with followers, respond to comments, and address customer inquiries to strengthen customer relationships and loyalty.
- Content Marketing:
a. Develop a blog on the brand’s website featuring educational and informative content about undergarments, trends, and styling tips.
b. Leverage video content on platforms like YouTube to showcase products, share tutorials, and engage with customers.
c. Create infographics or visually appealing content to share on social media platforms and drive website traffic.
- Email Marketing:
a. Build and segment email lists based on customer behavior, preferences, and demographics.
b. Send personalized email campaigns with targeted offers, promotions, and relevant content.
c. Utilize automation tools to nurture leads and encourage repeat purchases.
- Public Relations:
a. Develop press releases and media kits to promote product launches, collaborations, or brand milestones.
b. Cultivate relationships with industry journalists and bloggers to secure coverage in relevant publications.
c. Participate in industry events, trade shows, and fashion weeks to increase brand visibility and networking opportunities.
- Search Engine Marketing (SEM) and Search Engine Optimization (SEO):
a. Optimize website content and structure to improve organic search ranking on search engines like Google.
b. Utilize keyword research and on-page optimization to target relevant search queries.
c. Implement paid search campaigns (Google Ads) to capture high-intent search traffic and drive conversions.
- Affiliate and Influencer Marketing:
a. Develop an affiliate program to incentivize bloggers, influencers, and content creators to promote the brand and products in exchange for a commission on sales.
b. Collaborate with influencers on content creation, product reviews, and giveaways to generate buzz and increase brand exposure.
- Offline Advertising and Promotions:
a. Place ads in print magazines, newspapers, or on billboards that cater to your target audience.
b. Host in-store events, pop-up shops, or fashion shows to create memorable experiences and connect with customers.
Budget allocation across channels:
Financials
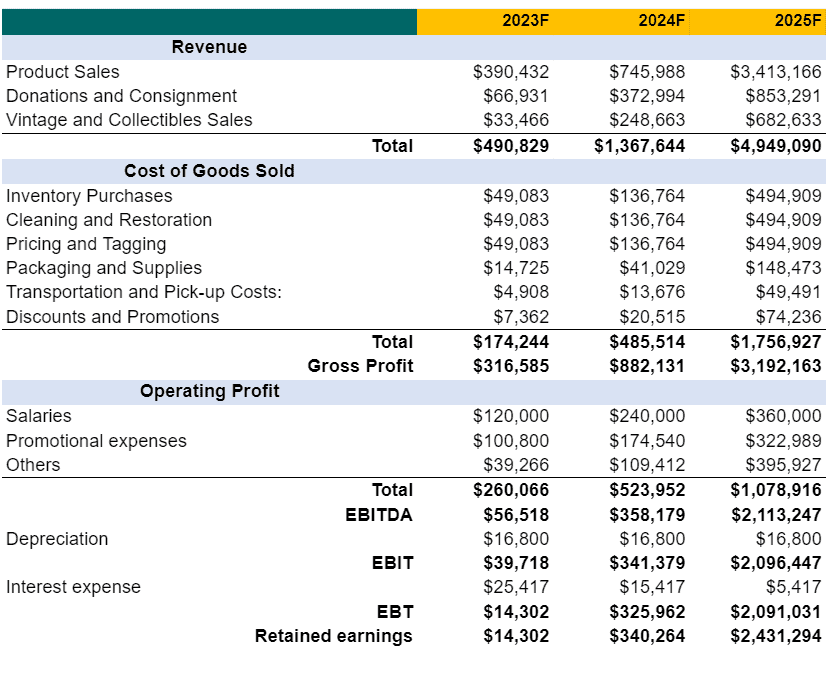
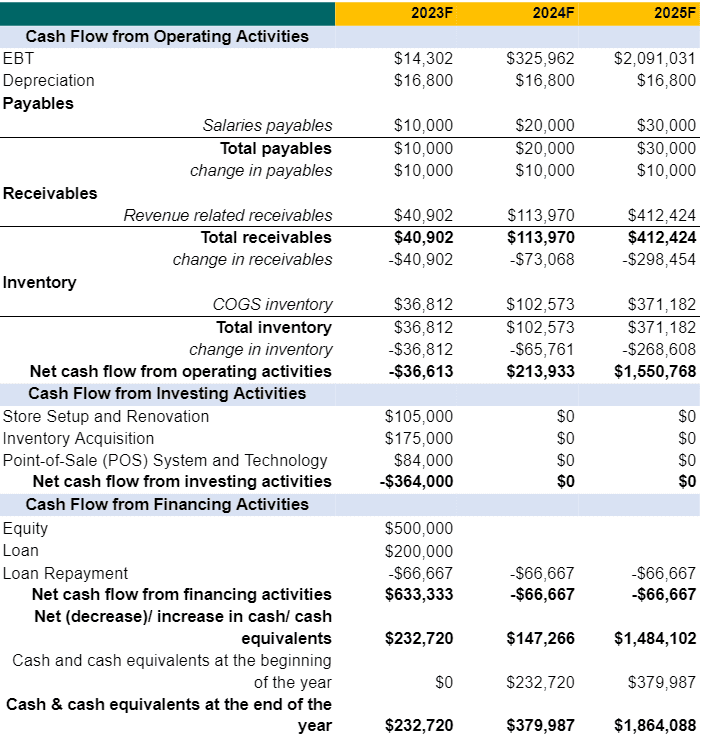
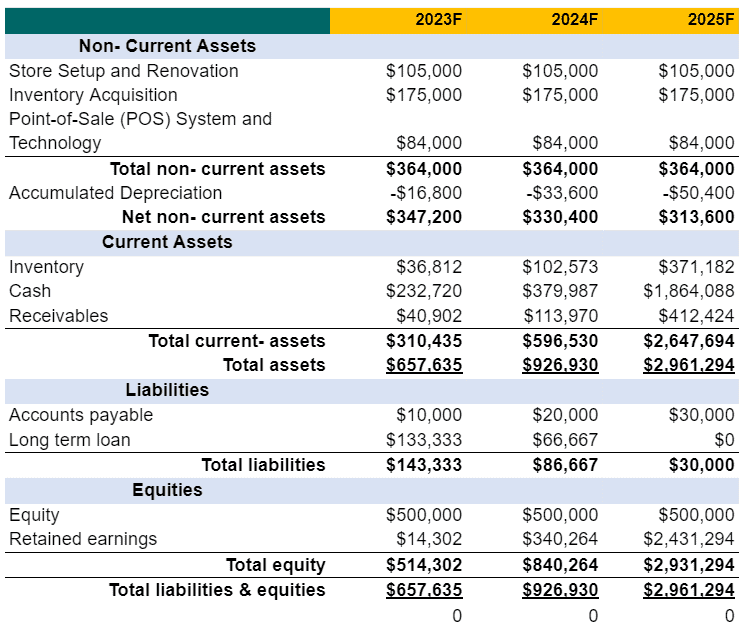
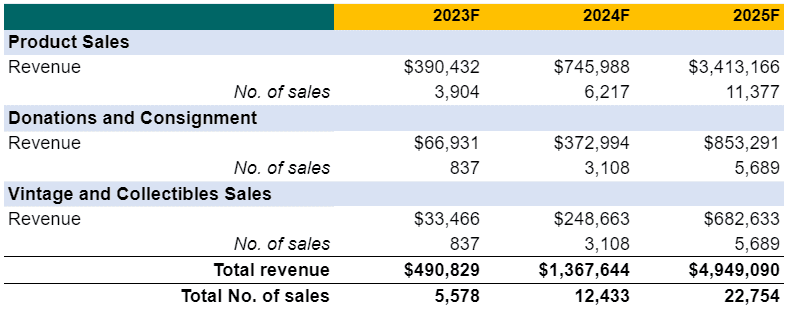
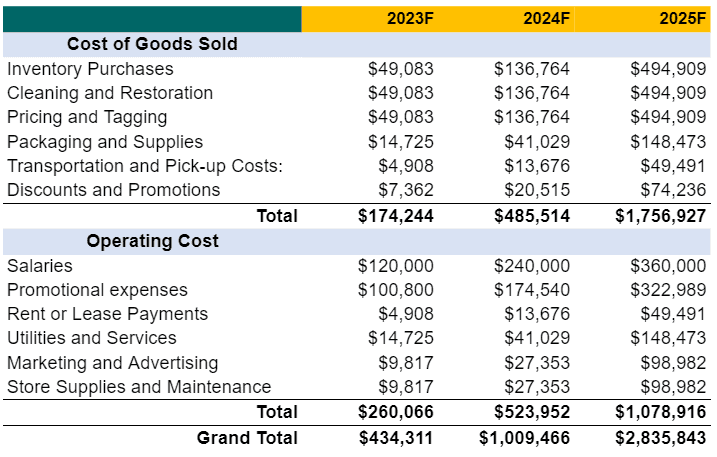
A financial plan of a Thrift Store business plan provides a comprehensive projection of a company’s financial health and its anticipated monetary performance over a specified period. This section encompasses a range of financial statements and projections such as profit and loss statements, balance sheets, cash flow statements and capital expenditure budgets. It outlines the business’s funding requirements, sources of finance and return on investment predictions. The financial plan gives stakeholders particularly potential investors and lenders a clear understanding of the company’s current financial position. A financial plan helps businesses demonstrate their financial prudence, sustainability, and growth potential.
Earnings
Liquidity
Income Statement
Cash Flow Statement
Balance Sheet
Revenue Summary
Cost Summary
Salaries
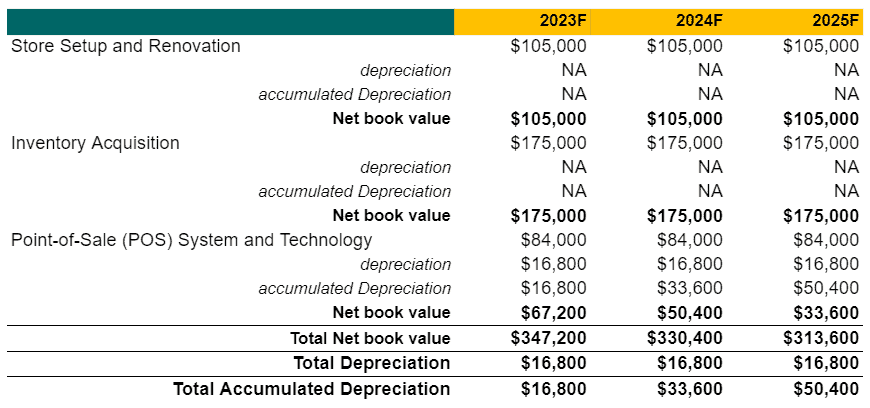
Non- Current Asset Schedule
