Written by Elma Steven | Updated on April, 2024

How to Write a Bakery Business Plan?
Bakery Business Plan is an outline of your overall Bakery business. The business plan includes a 5 year projection, marketing plan, industry analysis, organizational overview, operational overview and finally the executive summary. Remember to write your executive summary at the end as it is considered as a snapshot of the overall business plan. The creation of a plan requires careful consideration of various factors that might impact the business’s success. Ultimately, a Bakery business plan serves as a roadmap to guide the company’s direction.
Table of Contents
Executive Summary
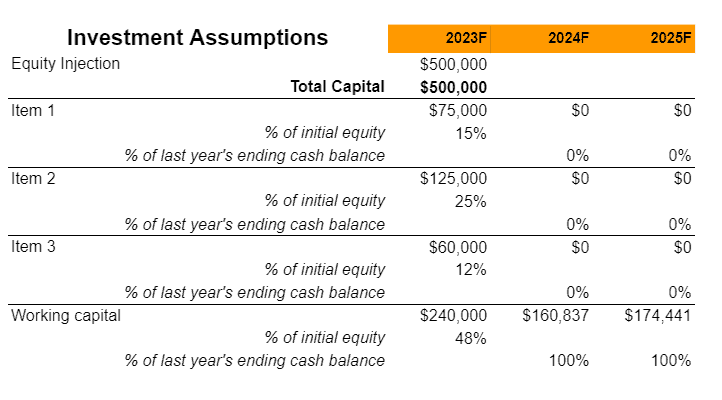
Natalie’s Bakery, a well-established business with a 15-year presence in Texas, specializes in a range of bakery products, catering primarily to bagel, bun, roll, biscuit, and loaf bread enthusiasts. Founded by Elma Stevenson and Adam Smith, who collectively boast over 30 years of industry experience, the bakery has become a staple for mid-income customers across Dallas, Houston, and San Antonio. Registered as an LLC in Texas, Natalie’s Bakery now seeks a $500k bank loan to expand its operations into Washington and Virginia.
Target Market: Natalie’s Bakery has successfully identified and served its primary target market, focusing on cities like Dallas, Houston, and San Antonio. The business appeals to mid-income demographics, a strategy that has proven effective in these regions.
Industry Overview: The bakery industry, within which Natalie’s Bakery operates, is valued at $30 billion across the United States and is experiencing growth at a CAGR of 5%. The market size in our immediate target areas is $2 billion, presenting significant opportunities for expansion. The industry landscape features major competitors such as Panera Bread and Boudin Bakery, but Natalie’s Bakery’s unique value proposition has allowed it to carve out a loyal customer base.
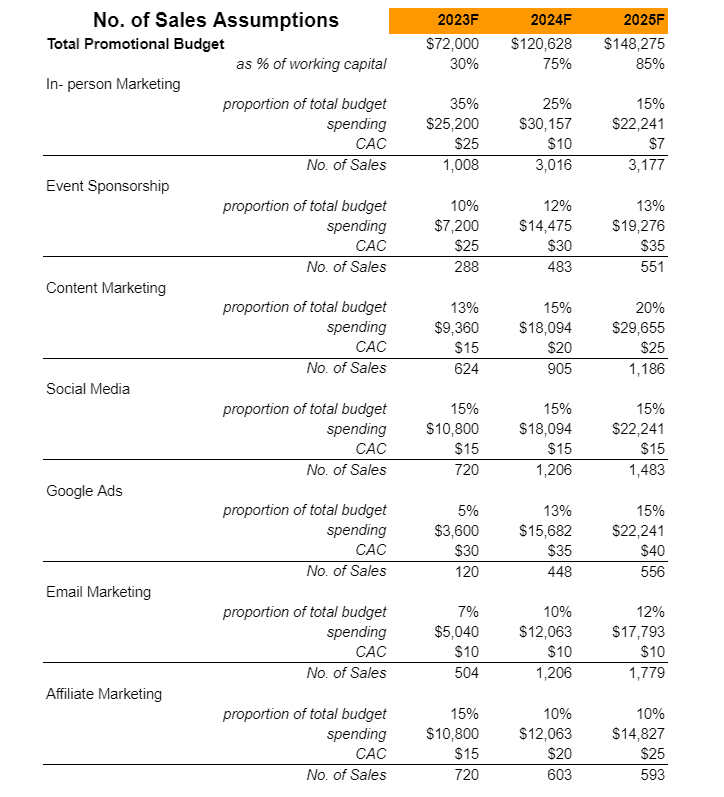
Marketing Overview: Natalie’s Bakery employs a strategic marketing approach, utilizing social media and local advertising for promotions. These channels have been chosen for their efficiency in lowering customer acquisition costs and leveraging our team’s in-house expertise. Future marketing plans include allocating a promotional budget towards digital marketing campaigns and community event sponsorships, ensuring a balanced and forward-thinking marketing strategy. Check out this guide on how to write an executive summary? If you don’t have the time to write on then you can use this custom Executive Summary Writer to save Hrs. of your precious time.
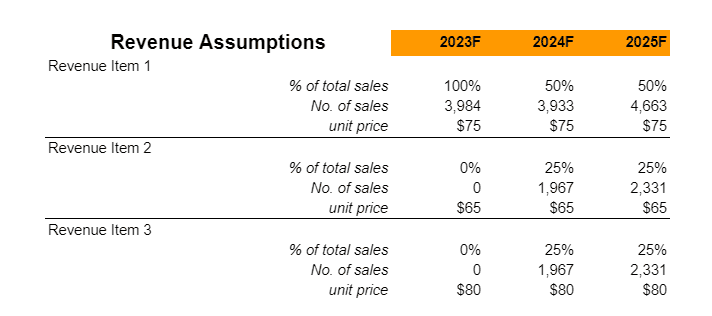
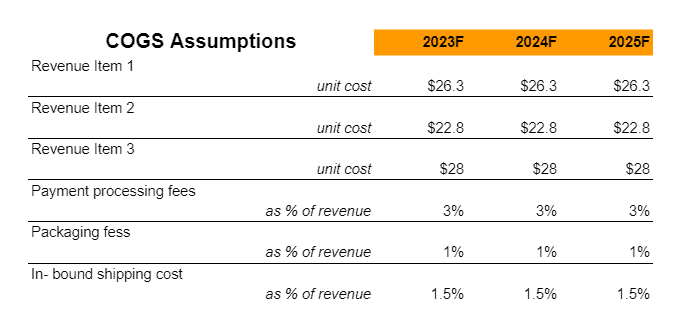
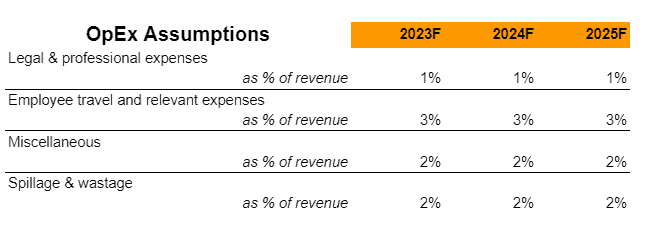
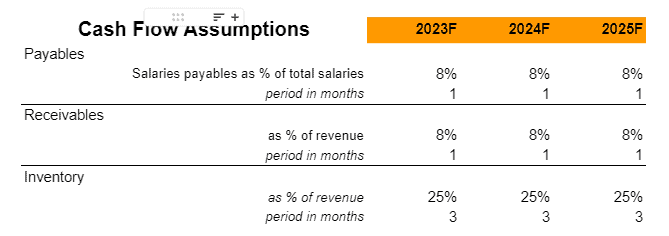
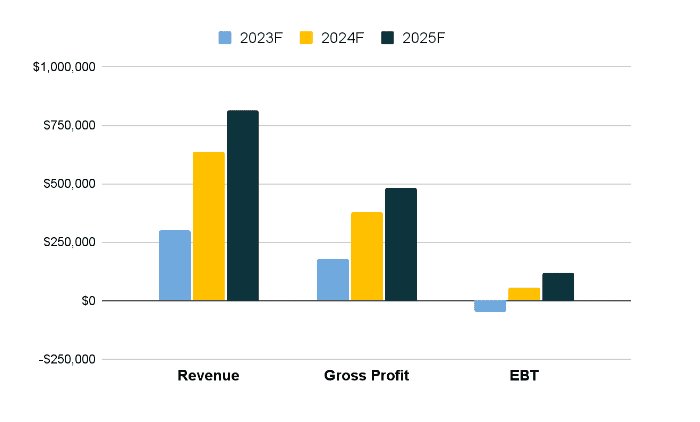
Financial Overview:

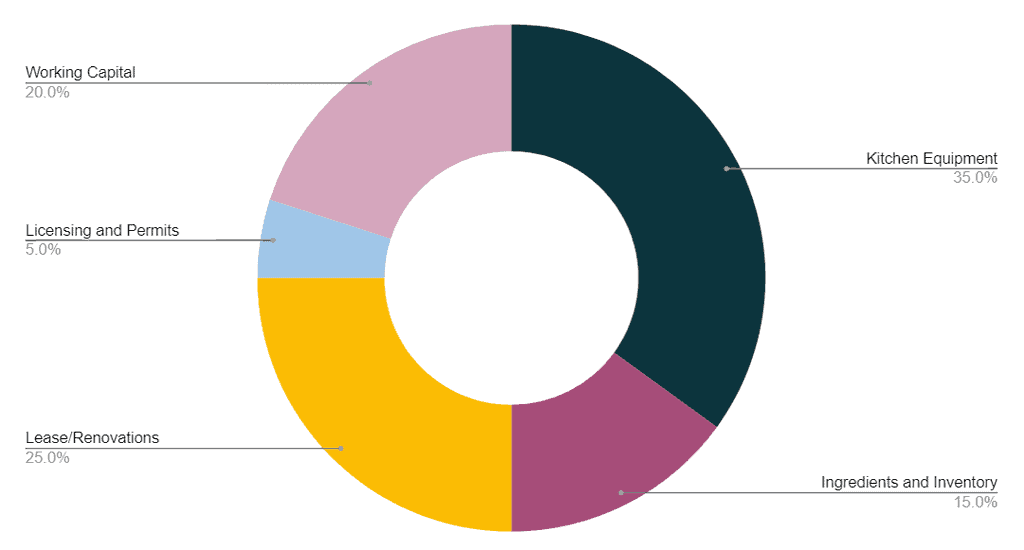
Fund Usage
Business Model Canvas
Tips on Business Model Canvas
The Business Model Canvas is a high-level overview of the business model. It can also be considered as the business model map in the overall plan. The important partners, key activities, value proposition and cost & revenue sections are only some of the nine vital components. A company idea’s complexities may be mapped out, analyzed and communicated with the use of the canvas. It shows the whole picture of a company’s value creation, delivery and capture processes. It helps new business owners hone their ideas, encourage creative thinking and make sound strategic decisions. It’s a helpful resource for coming up with ideas, organizing plans and presenting business models to key players. Check out the 100 samples of business model canvas.

SWOT
Tips on SWOT Analysis
It offers a clear lens into a company’s strengths, weaknesses, opportunities and threats. This self-awareness enables effective resource allocation and strategic positioning against competitors. Businesses can mitigate risks, make informed decisions and set realistic goals. In addition, presenting a SWOT analysis in a business plan communicates to stakeholders that the company possesses a deep understanding of its market environment. In essence, SWOT ensures a business’s strategy is grounded in reality enhancing its chances of success. Check out the 100 SWOT Samples

Industry Analysis
Natalie’s Bakery operates in the vibrant bakery industry of the United States, currently valued at approximately $30 billion. This sector has witnessed a steady growth trajectory, with an annual compound growth rate (CAGR) of 5%. The industry is characterized by a diverse product range, from bread and rolls to pastries and cakes, catering to a wide array of consumer preferences. In recent years, there has been a notable shift towards health-conscious and artisanal products, a trend that Natalie’s Bakery can leverage, especially given its focus on mid-income groups in urban areas like Dallas, Houston, and San Antonio. This segment of the market, valued at around $2 billion, is increasingly looking for quality, variety, and convenience in bakery products.
The bakery industry is moderately fragmented, with significant players like Panera Bread and Boudin Bakery setting high standards in terms of product quality and customer service. However, there is ample room for specialized businesses like Natalie’s Bakery to thrive, particularly when they focus on unique offerings and personalized experiences. The key to success in this competitive environment lies in differentiating oneself through specialty products, exceptional service, and effective marketing strategies. For Natalie’s Bakery, expanding its product range to include healthier, artisanal options could be a strategic move to attract health-conscious consumers and differentiate itself from larger chains.
Looking ahead, the bakery industry in the United States shows promising growth potential, especially in urban and suburban regions where consumer spending power is higher. Natalie’s Bakery’s planned expansion into Washington and Virginia aligns well with the industry’s growth trajectory. The increasing popularity of café culture and the demand for convenient yet high-quality food options present significant opportunities for Natalie’s Bakery. With its strong foundation in Texas and a well-planned expansion strategy, Natalie’s Bakery is well-positioned to capitalize on these market trends, potentially increasing its market share and establishing a stronger brand presence in the industry. The investment in expanding its geographical footprint could open up new customer bases and further solidify its position as a beloved bakery brand.

Source: smallbusiness.chron
From 2019 to 2025, the worldwide bakery product market is expected to grow at a CAGR of 3.2 percent. Over the anticipated years, rising consumption of ready-to-eat meals worldwide is expected to increase product demand. In Europe, the rising demand for bread items has been driven by a growing appetite for ethnic foods and the popularity of Thai and Mexican cuisine in restaurants.
To win more market share, major corporations are expanding their global footprint. The firms’ ability to create joint warehouses in strategic locations remains a significant success element. Due to rising snack consumption, the cakes and pastries market is expected to grow at the quickest rate between 2019 and 2025.
Because of the high presence of important corporations in rising nations like China, India, Singapore, and Japan, Asia Pacific is predicted to grow quickly throughout the projection years. Furthermore, increased per capita income in these nations will aid regional market expansion. Milk, emulsifiers, fat, stabilizers, flavors, sugar, and flour are the most common essential ingredients used in bread items.
The cost of these components and their availability has a significant impact on the price of bakery goods. Like Associated British Foods, Dawn Foods, and Bakels, many organizations have integrated backward to fight supply-demand mismatches and volatility. Because the product must be carried in specifically constructed automobile components with state-of-the-art refrigeration capabilities, the bakery product industry uses a lot of energy. It has a lot of transportation and storage expenses. To some degree, these constraints may limit the market growth.

Source: mordorintelligence
Flavors and fat content and texture, and sweetness are all variables impacting the industry’s development. The bread and rolls sector is predicted to develop significantly due to increased demand in North America and the Asia Pacific. Because of the introduction of unique tastes and growing consumer disposable income levels, the cakes and pastries category is predicted to develop the quickest during the projection period, accounting for the highest market share. As Asia Pacific’s population grows, long-term prospects for industry players will be created. Because of the introduction of new flavors, forms, and textures to the product, the cookies product sector is expected to develop strongly.
The market is split into hypermarkets and supermarkets, convenience shops, specialty stores, and others based on distribution channels. The worldwide market’s primary distribution channels are specialty shops and convenience stores. Specialty retailers are likely to be the most prominent and fastest-growing category throughout the projected period. By 2025, it is predicted to have a market share of over 33%.
Because of the increasing demand for baked goods, such as gluten-free, high-fiber, and Trans fat products, which staple foods, Europe is predicted to be the dominating and second-fastest-growing regional market. Because of expanding population and per-capita income, developing markets are expected to present growth prospects. Furthermore, the rising demand for breakfast grains and cereals in China and India will fuel the industry. Due to brand loyalty and large capital expenditures, high entry barriers are likely to keep competition fierce. Major corporations strive for maximum commercial expansion using a variety of growth tactics, including joint ventures, mergers and acquisitions, strategic collaborations with regional manufacturers, and distribution channel diversification. Kraft Food Group, Inc., Nestle S.A., Bimbo Bakeries USA, Britannia Industries Ltd., General Mills, Associated British Foods, and Campbell Soup Company are just a few of the major players in the business.
Marketing Plan
A marketing plan outlines the company’s strategy to promote its products or services to its target audience. It includes specific tactics and channels the business will use to reach potential customers. This section defines the company’s unique value proposition, identifies the target market segments, and discusses the competitive landscape. It also includes insight into budget allocation, projected outcomes and key performance indicators to measure success. Marketing plan helps businesses demonstrate their understanding of the market dynamics, their positioning within the industry and their approach to driving customer engagement and sales.

Website: A promotional banner will be posted on Prantl’s Bakery website so visitors will know about our new products.
Social Media: Prantl’s Bakery will be posting photos of our new bread and pastries on our Facebook and Instagram pages to reach a broad audience through this platform.
Promotions & Events: Prantl’s Bakery offers weekly classes on cake decorations. Attending events and giving free samples is an excellent opportunity to promote Prantl’s Bakery products.
Catalog/Brochures: Sending Digital Catalog and distributing printed brochures is also a means of promoting Prantl’s Bakery.
Free Samples: We will be sending samples to retail venues like restaurants and cafes to show how delicious our new products are.
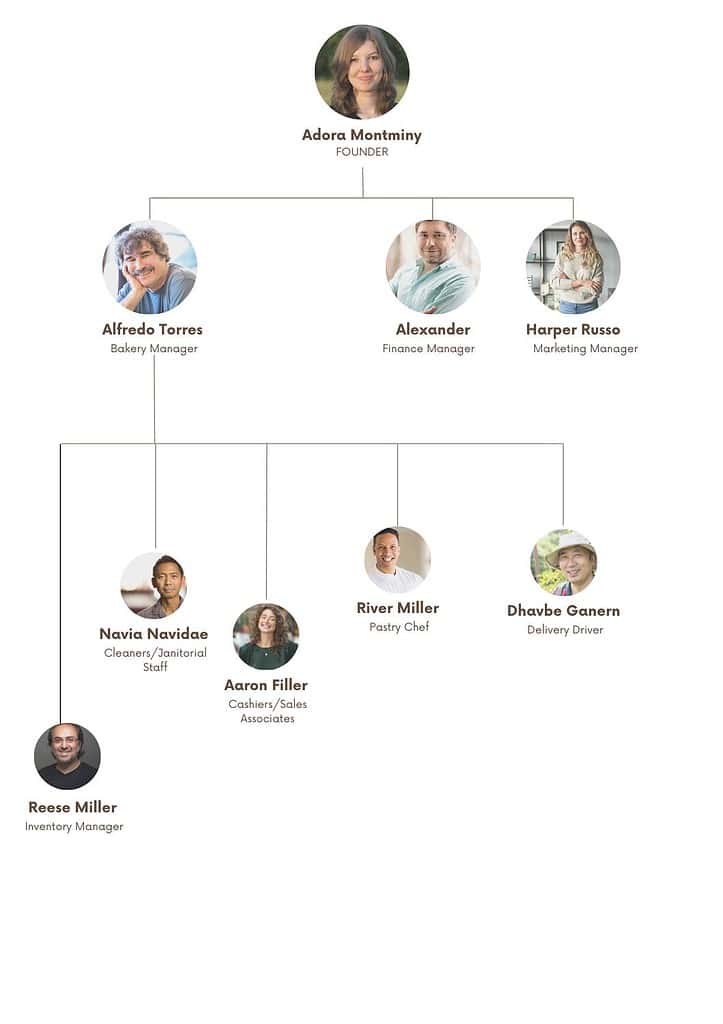
Organogram
Financial Plan
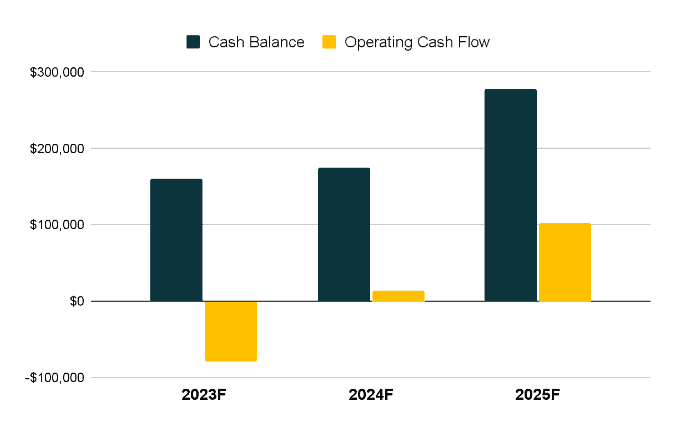
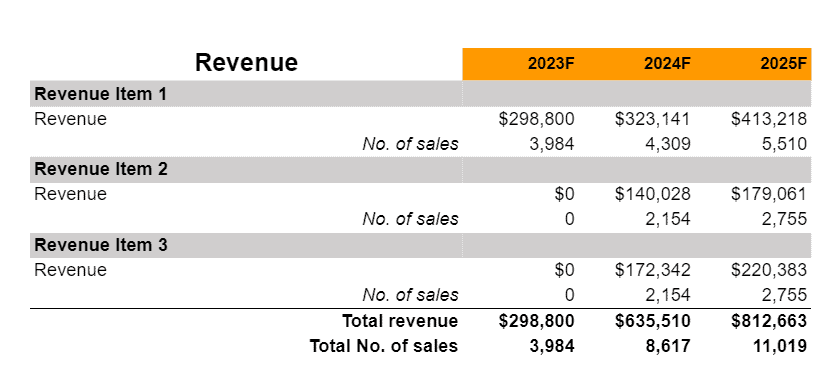
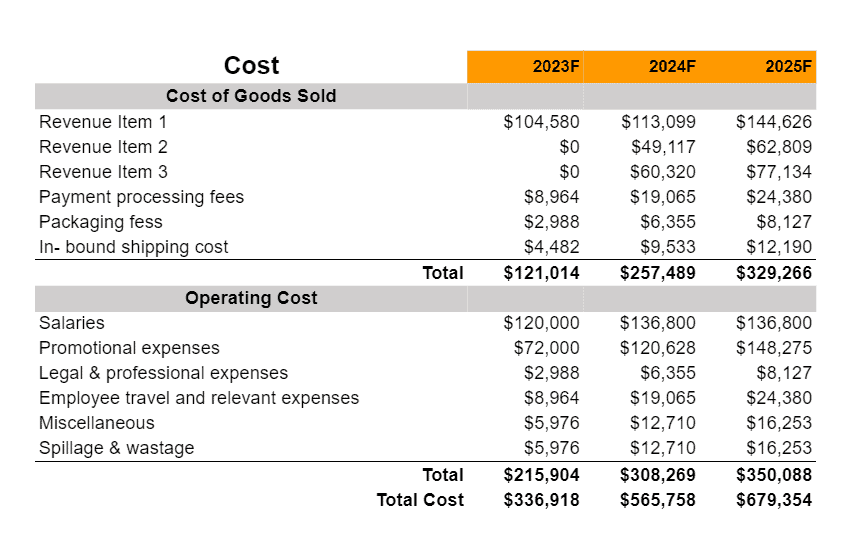
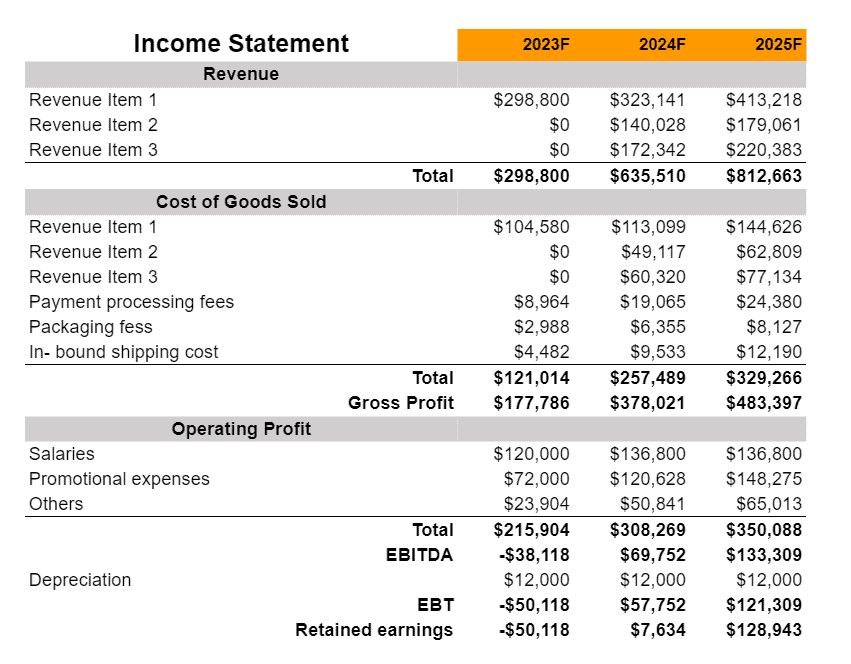
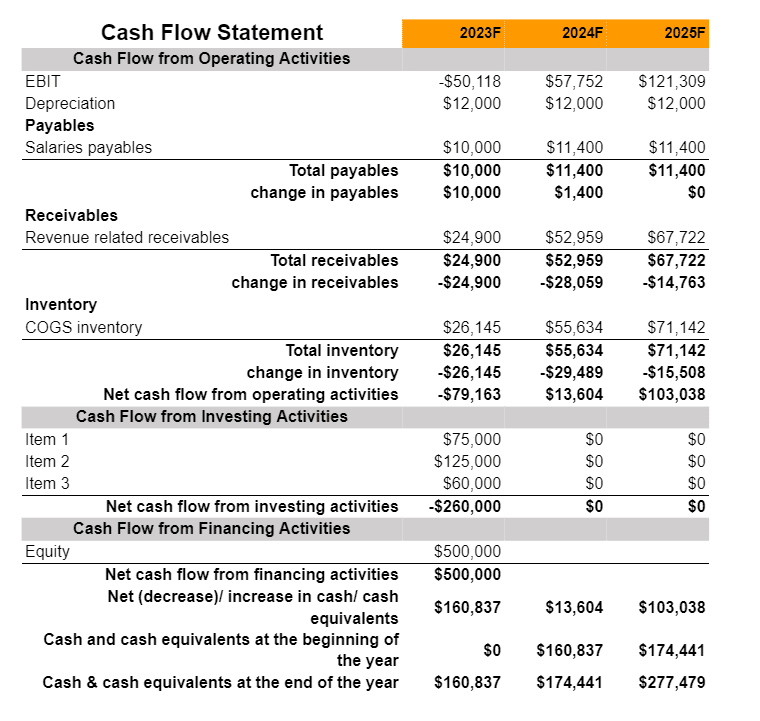
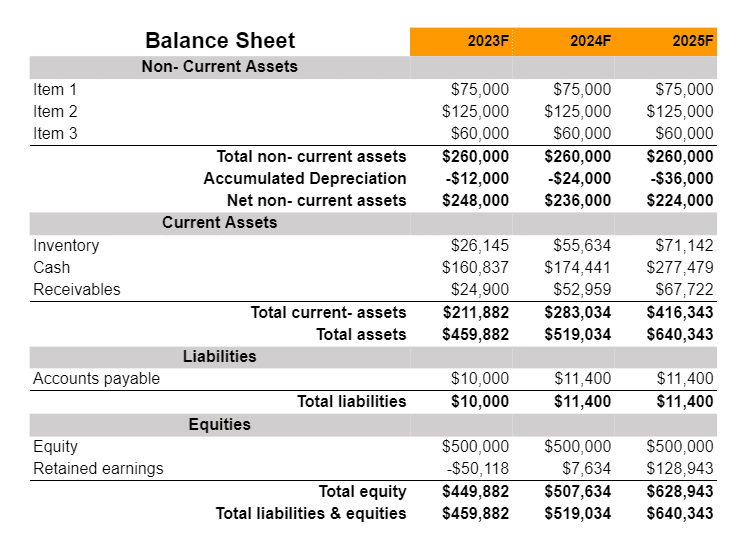
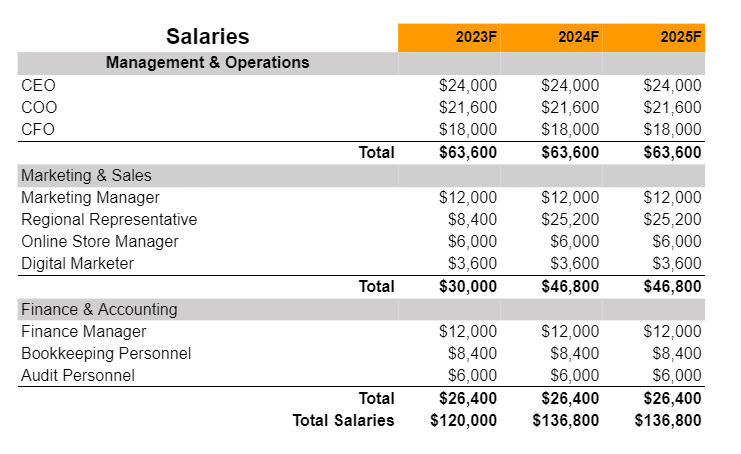
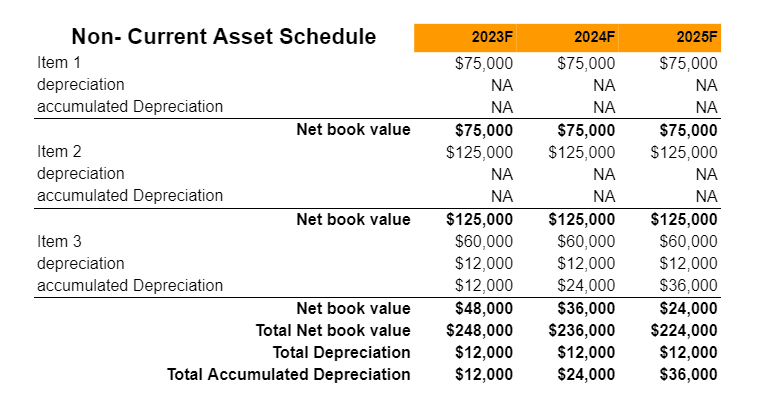
A financial plan provides a comprehensive projection of a company’s financial health and its anticipated monetary performance over a specified period. This section encompasses a range of financial statements and projections such as profit and loss statements, balance sheets, cash flow statements and capital expenditure budgets. It outlines the business’s funding requirements, sources of finance and return on investment predictions. The financial plan gives stakeholders particularly potential investors and lenders a clear understanding of the company’s current financial position. A financial plan helps businesses demonstrate their financial prudence, sustainability, and growth potential.
Earnings
Liquidity
