Written by Elma Steven | Updated on April, 2024

How to Write an Online Boutique Business Plan?
Online Boutique Business Plan is an outline of your overall Online Boutique business. The business plan includes a 5 year projection, marketing plan, industry analysis, organizational overview, operational overview and finally the executive summary. Remember to write your executive summary at the end as it is considered as a snapshot of the overall business plan. The creation of a plan requires careful consideration of various factors that might impact the business’s success.
Table of Contents
Executive Summary
Rebel Vine Boutique was born out of a desire to defy society’s beauty and fashion norms by offering ethically sourced items beneficial for you and the environment. We are aware that change takes time, but we can make sustainable beauty and fashion the norm. So we’re here for the rule-breakers as well as the rule-makers. We provide valuable items to you, the craftsman, and the environment. We take pleasure in choosing items that exhibit at least one of the following qualities: Fair Trade, Cruelty-Free, Handmade, Sustainable, and Organic are just a few of the terms that come to mind when thinking about this product. Many of our goods are designed to symbolize different components. We offer something for everyone, from classic clothing to clean and gentle skincare to handcrafted jewelry. Feel confidence in your ability to look good, feel fantastic, and add a lot of individuality.
Mission: Create a healthier lifestyle for both fashion and beauty product curators and consumers.
Vision: Rebel Vine, we believe, will alter society’s perception of the fashion and cosmetics industries. By delivering ethically and responsibly sourced goods, we will safeguard the environment and mankind.
Industry Overview: As of 2023, the online boutique market continues to thrive, driven by increasing consumer preference for unique, curated shopping experiences. The global e-commerce fashion industry, a key segment for online boutiques, is projected to grow from $752 billion in 2020 to over $1 trillion by 2025. Online boutiques benefit from this trend, offering personalized selections and niche products that attract a diverse customer base. The rise of social media marketing and influencer collaborations further fuels the growth, enabling boutiques to reach wider audiences cost-effectively. The market is competitive, but the demand for distinct, quality products and personalized shopping experiences provides ample opportunities for new entrants. Check out this guide on how to write an executive summary? If you don’t have the time to write on then you can use this custom Executive Summary Writer to save Hrs. of your precious time.
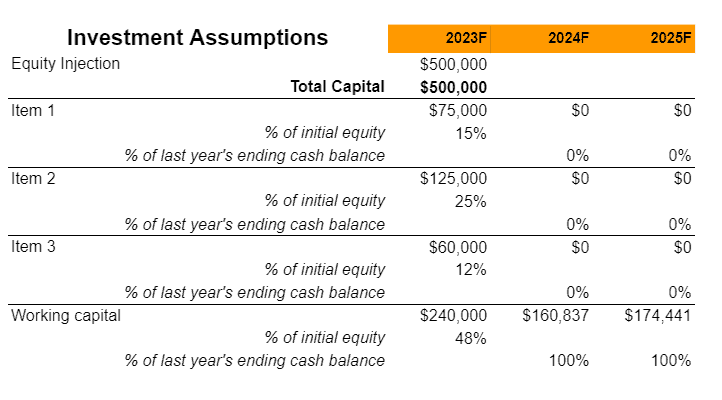
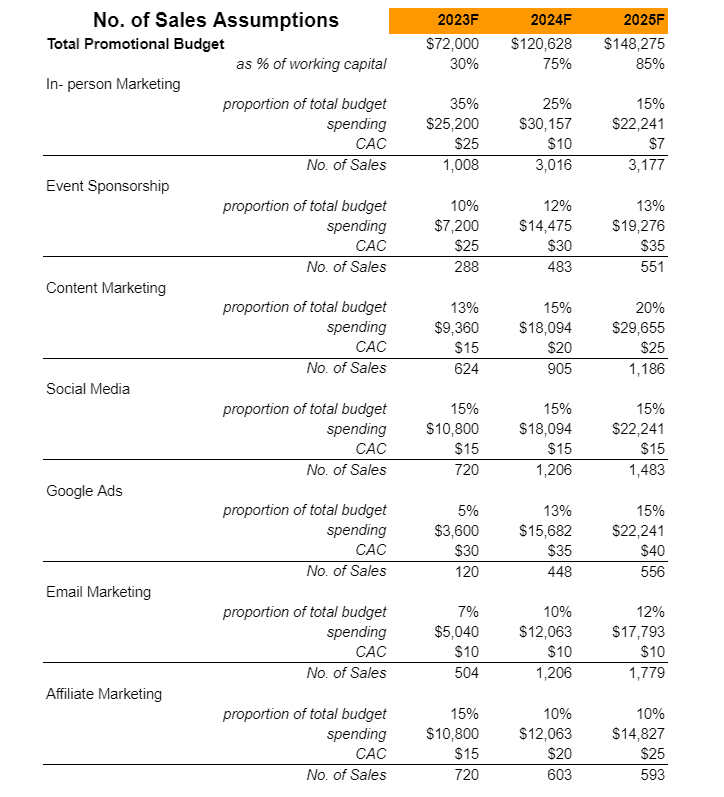
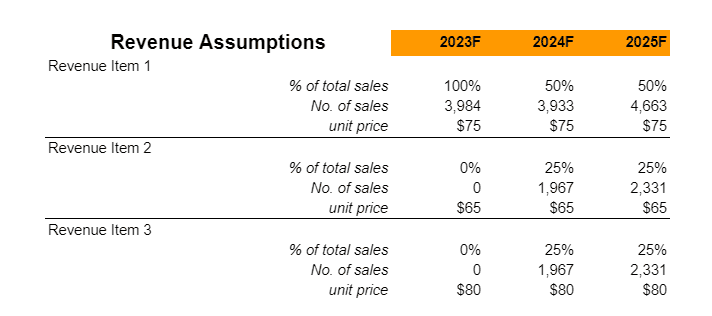
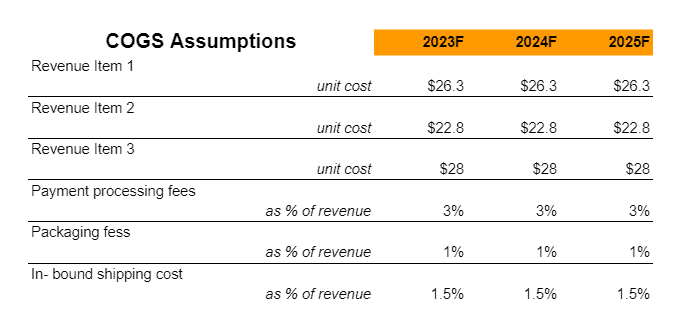
Financial Overview:

FUND USAGE

Business Model Canvas
Tips on Business Model Canvas
The Business Model Canvas is a high-level overview of the business model. It can also be considered as the business model map in the overall plan. The important partners, key activities, value proposition and cost & revenue sections are only some of the nine vital components. A company idea’s complexities may be mapped out, analyzed and communicated with the use of the canvas. It shows the whole picture of a company’s value creation, delivery and capture processes. It helps new business owners hone their ideas, encourage creative thinking and make sound strategic decisions. It’s a helpful resource for coming up with ideas, organizing plans and presenting business models to key players. Check out the 100 samples of business model canvas.

SWOT
Tips on SWOT Analysis
It offers a clear lens into a company’s strengths, weaknesses, opportunities and threats. This self-awareness enables effective resource allocation and strategic positioning against competitors. Businesses can mitigate risks, make informed decisions and set realistic goals. In addition, presenting a SWOT analysis in a business plan communicates to stakeholders that the company possesses a deep understanding of its market environment. In essence, SWOT ensures a business’s strategy is grounded in reality enhancing its chances of success. Check out the 100 SWOT Samples

Industry Analysis
The online boutique industry, as part of the broader e-commerce sector, is experiencing rapid growth. In 2023, the global e-commerce market is expected to continue its expansion, with a projected increase to over $5 trillion. Online boutiques, characterized by their unique product offerings and personalized customer experiences, are capturing a significant portion of this market. They benefit from low overhead costs compared to traditional retail and can leverage digital platforms to reach a global audience.
Consumer trends show a growing preference for online shopping, with over 2.14 billion people worldwide expected to purchase goods and services online by 2023. Online boutiques cater to this demand by offering niche products, often not available in mainstream retail stores. This exclusivity, coupled with personalized customer service, positions online boutiques favorably against larger e-commerce players.
The future of online boutiques is tied to technological advancements and innovative marketing strategies. The use of AI for personalized recommendations, AR for virtual try-ons, and social media for targeted advertising are shaping the industry. Despite the competitive landscape, there is significant potential for growth, especially for boutiques that successfully leverage technology and create a unique brand identity. However, challenges such as logistics, customer retention, and the need for continuous digital innovation remain critical factors for success in this dynamic market.
The online boutique industry is also heavily influenced by evolving consumer behaviors and market trends. With the increasing awareness of sustainability and ethical production, many online boutiques are shifting towards eco-friendly and ethically sourced products. This trend not only appeals to environmentally conscious consumers but also helps these businesses stand out in a crowded market. Additionally, the rise of influencer marketing and social media platforms has opened new avenues for customer engagement and brand promotion. Online boutiques are increasingly collaborating with influencers to tap into their follower base, thereby gaining wider visibility and credibility.

Source: zipdo
By 2021, online channel sales are estimated to account for 22% of global fashion market revenues, with eCommerce penetration reaching 50%. There are no limits to the opportunities in the online fashion market, with development projected to continue for the foreseeable future. The fashion industry’s eCommerce sales are increasing globally, and this trend is projected to continue shortly. On the other hand, certain nations are growing exponentially, vastly outpacing others.
In 2020, China sold over $284 billion worth of goods, with the United States coming in second with just over $126 billion. Despite China’s considerably faster development in the industry than other countries, the expansion of the US and UK should not be overlooked. Many western countries and brands continue to play an essential role in pushing up worldwide sales, and this trend is predicted to continue, just as it has in China. It’s worth noting that many customers in western countries, such as the United States, spend more per user, suggesting that China’s rapid rise is partly due to the mere fact that it has a far greater population to target.
Resale is a fashion eCommerce trend that is coming back as the fashion industry works toward a more sustainable model as post-pandemic spending habits compel firms to be more responsible. The online and offline resale market, which is expected to expand at a 39 percent annual pace from $7 billion in 2019 to $36 billion by 2024, has a fresh lease of life in its drive to remain an inexpensive, sustainable method stay up with fashion. The resale market was on course to quadruple before the outbreak. This expansion might now accelerate. As the epidemic wreaks havoc on the economy, resale sites are reaping the benefits.
Source: bigcommerce
Resale revenue in the United States climbed by more than 50% from 2008 to 2016 after the Great Recession. Sales at department stores dropped by 25% due to the rise, and history seems to be repeating itself.
In 2019, resale was already expanding 25% faster than the whole retail industry, with about 20,000 used product outlets producing $17.5 billion in yearly sales throughout America, according to a survey published by First Research.
Marketing Plan:
A marketing plan outlines the company’s strategy to promote its products or services to its target audience. It includes specific tactics and channels the business will use to reach potential customers. This section defines the company’s unique value proposition, identifies the target market segments, and discusses the competitive landscape. It also includes insight into budget allocation, projected outcomes and key performance indicators to measure success. Marketing plan helps businesses demonstrate their understanding of the market dynamics, their positioning within the industry and their approach to driving customer engagement and sales.

Website: We have a user-friendly website with a variety of product alternatives. Our pricing and images are periodically verified and updated.
Email: We’ll send out emails on a regular basis with special product releases and other emails that will entice potential consumers to visit our site.
Social Media: Using engaging photographs and videos to boost our social media channel.
SEO: Our on-page material naturally utilizes our consumers’ language, making it easier for them to find.
Blogging: To encourage consumers, we will provide useful and entertaining material.
Organogram:

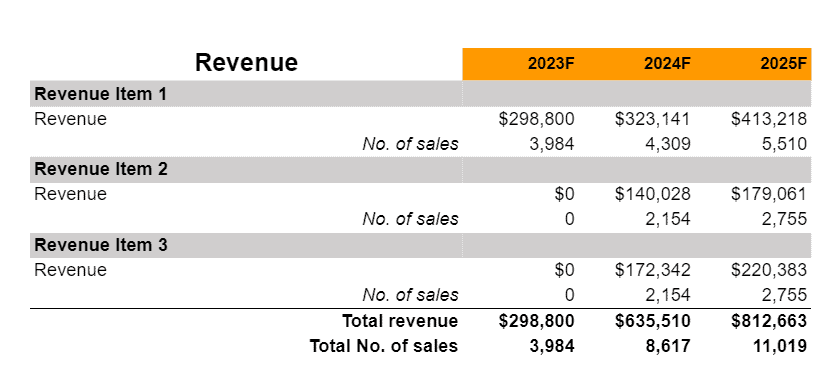
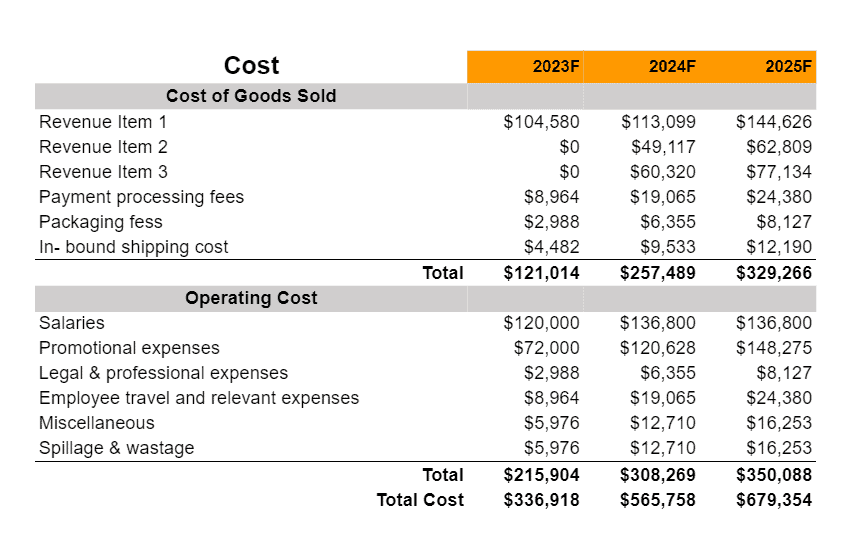
Financial Plan:
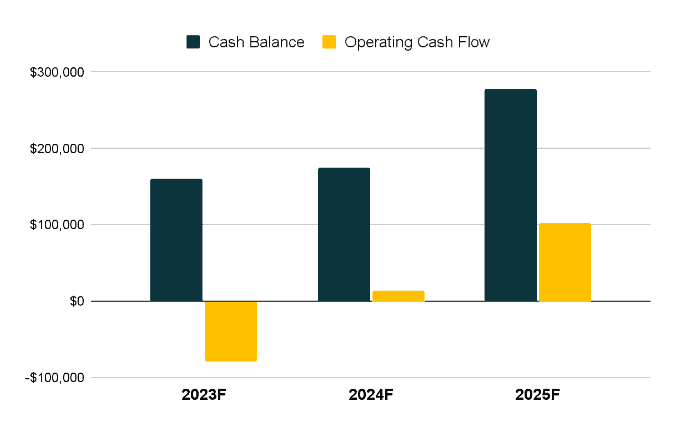
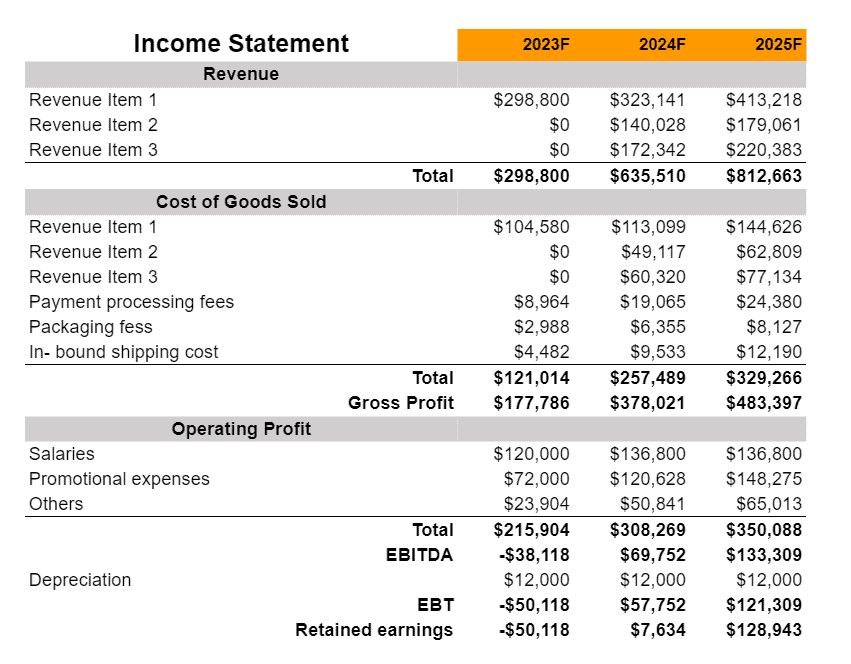
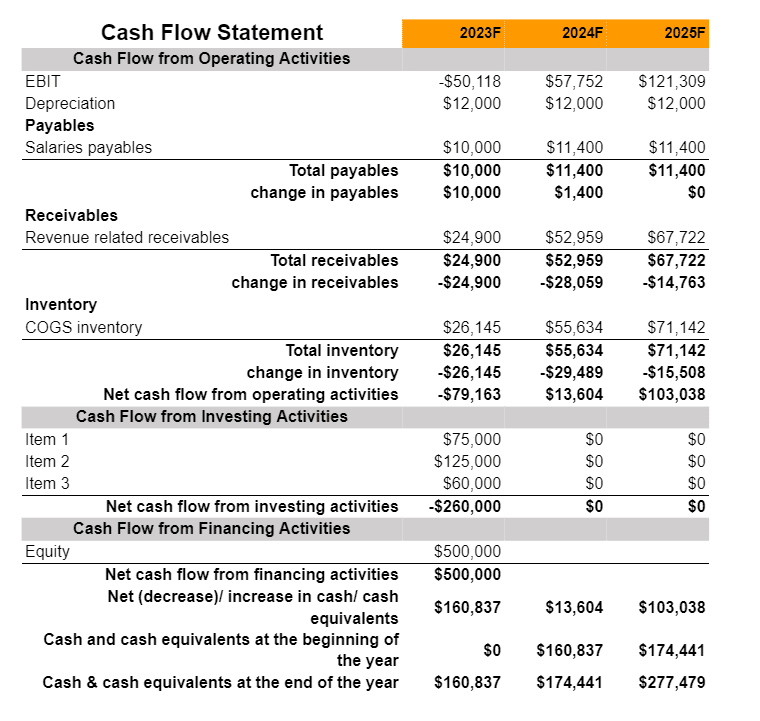
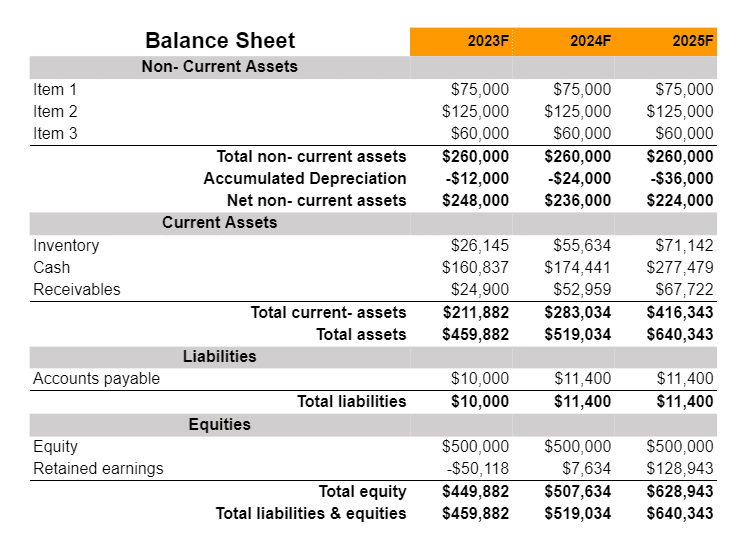
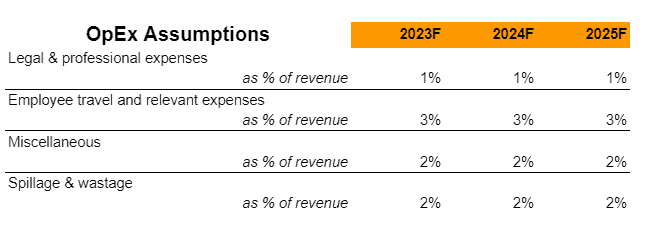
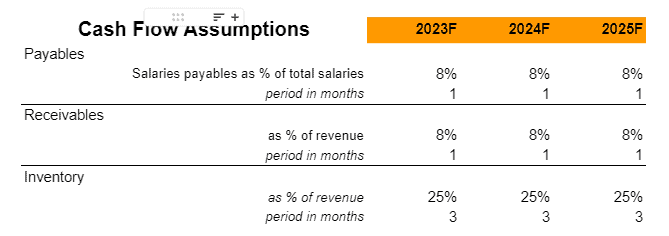
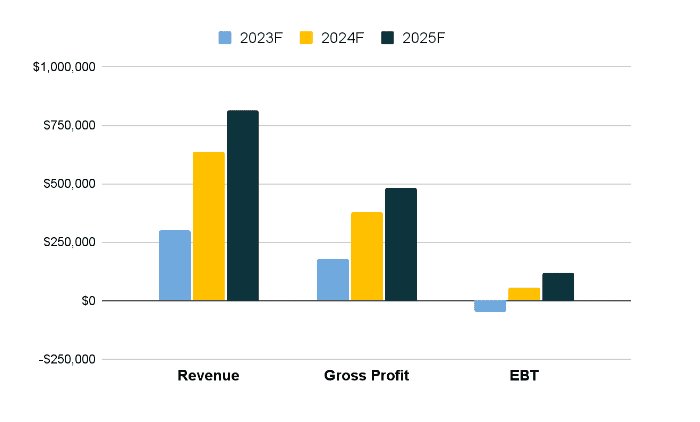
A financial plan provides a comprehensive projection of a company’s financial health and its anticipated monetary performance over a specified period. This section encompasses a range of financial statements and projections such as profit and loss statements, balance sheets, cash flow statements and capital expenditure budgets. It outlines the business’s funding requirements, sources of finance and return on investment predictions. The financial plan gives stakeholders particularly potential investors and lenders a clear understanding of the company’s current financial position. A financial plan helps businesses demonstrate their financial prudence, sustainability, and growth potential.
Earnings
Liquidity
