Written by Elma Steven | Updated on June, 2024

How Do I Write the Coworking Space Business Plan?
Coworking Space Business Plan is an outline of your overall coworking space business. The business plan should includes a 5 year financial projection, marketing plan, industry analysis, organizational overview, operational overview and finally an executive summary. Remember to write your executive summary at the end as it is considered as a snapshot of the overall business plan. You need to be careful while writing the plan as you need to consider various factors that can impact the business’s success.
Table of Contents
Executive Summary
Maria Gonzalez is responsible for creating a unique coworking facility in the center of Miami called Collaborative Canvas Coworking. Freelancers, startups and small enterprises may take use of our facility’s many amenities such as our private offices, conference rooms and event spaces. Maria who has been managing workspaces and cultivating communities for over fifteen years, infuses Collaborative Canvas with her enthusiasm and knowledge. Our state-of-the-art facilities, community-focused atmosphere and dedication to encouraging teamwork and fresh ideas among Miami’s varied business community are what set us apart from the competition.
Mission: To provide Miami’s working class a boost by way of a motivating, team-oriented workplace. Our goal is to create a community where members may learn from one another and flourish in an atmosphere of mutual support and creative freedom.
Vision: To be recognized as Miami’s premier coworking space, renowned for encouraging innovation and promoting professional growth. Our mission is to become universally recognized as the driving force behind Miami’s diversified talent landscape, innovation and community involvement.
Industry Overview:
At a CAGR of 22.4%, the market is expected to increase from its 2022 valuation of $13.1 billion to $50.15 billion in 2028. The expansion is fueled by the emergence of the gig economy, the growing expense of conventional office space, the demand for flexibility and the need for community.
Check out this guide on how to write an executive summary? If you don’t have the time to write on then you can use this custom Executive Summary Writer to save Hrs. of your precious time.
Financial Highlights:
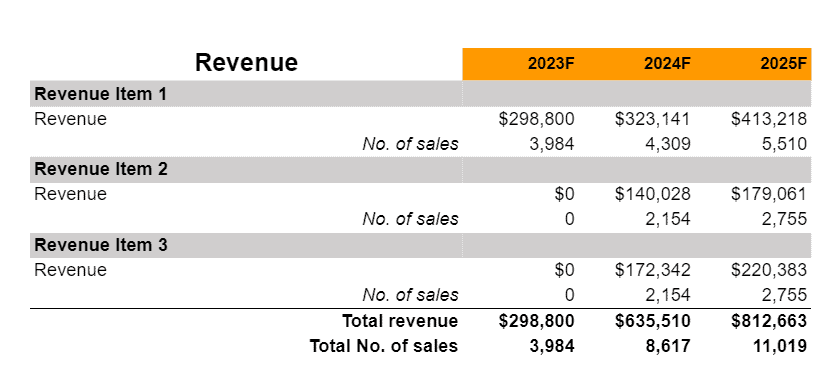
Revenue & Earnings

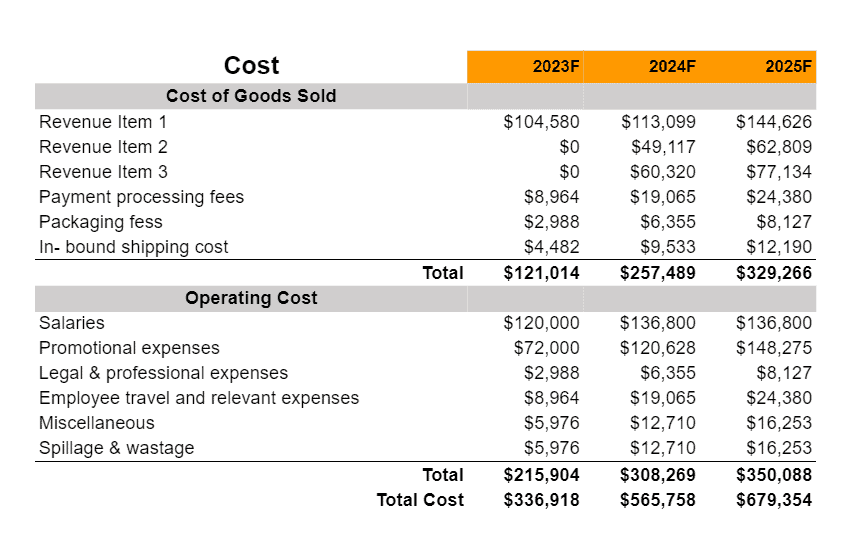
Cost of Goods Sold & Expenses

Break- Even Analysis

Investments or Fund Usage Plan

Business Description
Business Name: Collaborative Canvas Coworking
Founders: Maria Gonzalez
Management Team:

Legal Structure: LLC
Location: Miami
Goals & Objectives:
✔️Membership Growth: Increase membership by 20% annually, focusing on attracting a diverse mix of freelancers, startups and small businesses.
✔️Community Engagement: Hold seminars and networking events once a month to help members make connections and advance their careers.
✔️Brand Recognition: Establish a strong brand presence in Miami through targeted marketing campaigns, social media engagement and partnerships with local businesses and organizations.
✔️Facility Expansion: Add more private offices and conference spaces to the building during the next three years in response to member input and demand.
✔️Revenue Diversification: Introduce new revenue streams such as virtual office services, event space rentals and membership tier options.
Services:
✔️Meeting and Conference Facilities: For meetings, presentations and video chats the shared office has cutting-edge conference rooms and meeting rooms. These rooms are a flexible resource for a variety of business purposes since they may be reserved by both members and non-members and have state-of-the-art audio-visual equipment.
✔️Virtual Office Services: The coworking space provides its members with a professional mailing address via its Virtual Office Services. These services provide a level of professionalism and ease for remote and mobile professionals by processing mail and shipments, answering phones and taking messages.
✔️Event Spaces: Workshops, networking meetings and social gatherings would all be suitable for the space’s many multipurpose rooms. Members may use these facilities which both promotes community involvement and provides a convenient location for a variety of events.
✔️High-Speed Internet and IT Support: Wi-Fi and wired internet connectivity both of which are available here are essential in any contemporary workplace. IT assistance on-site to help with any technological difficulties that may arise making for a more efficient and trouble-free work environment for everyone involved.
✔️Printing and Office Supplies: The area is also furnished with basic office supplies like paper, pencils and staplers ensuring that members have all they need for effective functioning.
Business Model
Check out 100 samples of business model canvas.

SWOT
Check out the 100 SWOT samples which will give you a better idea on SWOT writing process.

Marketing Plan
The marketing plan has five main sections. These sections are marketing budget, marketing channels, GTM or Go To Market Strategy and brand management. The marketing budget will explain how much you plan to spend on promotions and what will be the proportion of spending across the channels. The marketing channels section will talk about how you plan to use each of the promotional channels. The GTM strategy can be considered as the short term version of promotional channels section where you explain how you plan to penetrate the market using the channels at the beginning. Finally, brand management is the longer term version of the promotional channels section where you explain how you plan to enhance brand awareness, recognition and brand recalls amongst your target market.
Promotional Channels
Social Media Marketing – $15,000 (30%)
✔️Platform Focus: Concentrate on networks like LinkedIn, Instagram and Facebook which are popular with professionals and companies. Showcase the shared office space with media including member testimonies and highlights from events.
✔️Paid Ads: Use targeted ads to reach freelancers, startups, small businesses and remote workers. Utilize the platforms’ algorithms to target based on professional interests and behavior.
✔️Content Strategy: Updates on the coworking space, its facilities and upcoming events. Weekly member profiles and productivity/work-life balance advice/articles
Website and SEO – $10,000 (20%)
✔️Website Revamp: Make sure your website is polished and professional, highlighting the benefits of working out of your coworking space and the praise of those who have used it.
✔️Blog Content: Publish articles on topics like entrepreneurship, remote working trends and productivity tips to drive organic traffic.
✔️SEO: To rise in search engine results emphasize phrases like “Miami business scene” and “coworking space.”
Email Marketing – $5,000 (10%)
✔️Newsletter: Produce a monthly newsletter informing members of the coworking space’s latest happenings, forthcoming events, member successes and any discounts or deals being offered.
✔️Segmentation: Tailor emails for different segments such as entrepreneurs, freelancers and local businesses.
Local Partnerships – $7,000 (14%)
✔️Business Events: Partner with local business events, workshops and seminars offering your space for hosting or as a networking venue.
✔️Collaboration with Educational Institutions: Collaborate with educational institutions to provide student-run initiatives, internships and networking mixers.
Influencer and Community Collaborations – $6,000 (12%)
✔️Collaborations: Partner with local business influencers, industry leaders or community figures for workspace sessions leveraging their audience for broader reach.
✔️Sponsorship Deals: Provide the shared office for free to local organizations or businesses in return for promotion on social media and name recognition.
Direct Mail and Local Advertising – $4,000 (8%)
✔️Direct Mail: Send out flyers or promotional materials to local businesses, educational institutions and professional organizations.
✔️Local Media: Invest in local business magazines, radio stations and community event sponsorships to develop a strong local presence.
Referral Program – $3,000 (6%)
✔️Referral Incentives: Create a referral scheme where existing members may earn perks for bringing in new clients to the coworking space.
Brand Management
Social Media Marketing
✔️Brand Voice and Visual Identity: Create a tone for your coworking space’s brand that will appeal to freelancers, independent contractors and small business owners by highlighting its cutting-edge features, stimulating community and time-saving layout. Use a similar visual design across media showing your space’s interiors, events and community activities.
✔️User-Generated Content: Encourage members to share their work experiences and tag your space. Repost these stories to build credibility and showcase the vibrant community in your space.
✔️Live Sessions: Host live tours of your space, Q&A sessions with members and discussions on topics relevant to freelancers, startups and remote workers to engage your audience.
Search Engine Marketing (SEM) and Local SEO
✔️Ad Copy: Focus on the unique aspects of your coworking space such as high-speed internet, networking events or flexible membership plans.
✔️Website Optimization: Make sure that keywords like “coworking space,” “Miami office rental” and “professional networking” are used to optimize your website for search engines and that it highlights the qualities of your space and member testimonials.
✔️Google My Business: Regularly update your listing with photos, available amenities and contact information to improve local search visibility.
Email Marketing
✔️Newsletter: Share updates about new facilities, networking events, special offers and highlight success stories or achievements of current members.
✔️Segmentation: Customize emails for different segments such as entrepreneurs, digital nomads, small businesses and local community groups.
Local Partnerships and Sponsorships:
✔️Business and Networking Events: To get your name out among local company owners and executives, consider hosting or sponsoring local business events and seminars.
✔️Collaboration with Educational Institutions: Partner with universities and training centers for student projects, career fairs and networking events.
Content Marketing
✔️Educational Content: Create blog posts, videos and infographics about entrepreneurship, work-life balance and productivity tips.
✔️Workspace Behind-the-Scenes: In order to convey a flavor of what it’s like to work in a coworking space, share some anecdotes and pictures from community events and the day-to-day routine.
Go To Market Strategy
Online Presence and Community Engagement
✔️Professional Website: Create a website that describes the benefits of working at your coworking space. Add a gallery exhibiting the space and community events and a simple booking system.
✔️Content Marketing: Regularly publish blog posts or articles on topics like entrepreneurship, work-life balance and productivity tips which can help boost search engine rankings.
✔️Local Directory Listings: Ensure your space is featured in local business directories and coworking space aggregators to increase local search presence.
✔️Partnerships: Collaborate with local companies, educational institutions and professional associations to give promotional incentives and create a strong network within the local community.
Space Launch Event and Promotional Offers
✔️Grand Opening Event: Throw a party to introduce people to your shared office. Organize a tour and networking event for area sole proprietors, independent contractors and small company owners.
✔️Introductory Discounts: Provide special rates for first-time members or bundle packages for different services to attract a diverse clientele.
Digital Marketing and Customer Relations
✔️Social Media Campaigns: Showcase your space’s amenities, events and member feedback on social media sites like LinkedIn, Instagram and Facebook. Engage your audience by revealing some of the process.
✔️Email Marketing: Regularly send newsletters with updates on new amenities, upcoming events and community highlights.
✔️Loyalty Program: Create a program that rewards loyal members with perks such as discounts, additional access to meeting rooms or guest passes.
Brand Awareness and Public Relations
✔️Local Media Outreach: Make connections with regional business publications, blogs and community channels to promote your coworking space via features, interviews and other means.
✔️Community Involvement: Participate in local business events, workshops or sponsor local community programs to increase brand visibility.
✔️Influencer Partnerships: Join forces with prominent businesses or thought leaders in your area to host events or produce content you can share on social media.
Performance Tracking
✔️Analytics and Feedback: Gather frequent feedback from members and use tools like Google Analytics to track the success of your marketing and engagement efforts.
✔️Adaptation: Stay flexible and ready to adjust your strategies based on performance metrics, member feedback and changing market trends.
Organizational Overview
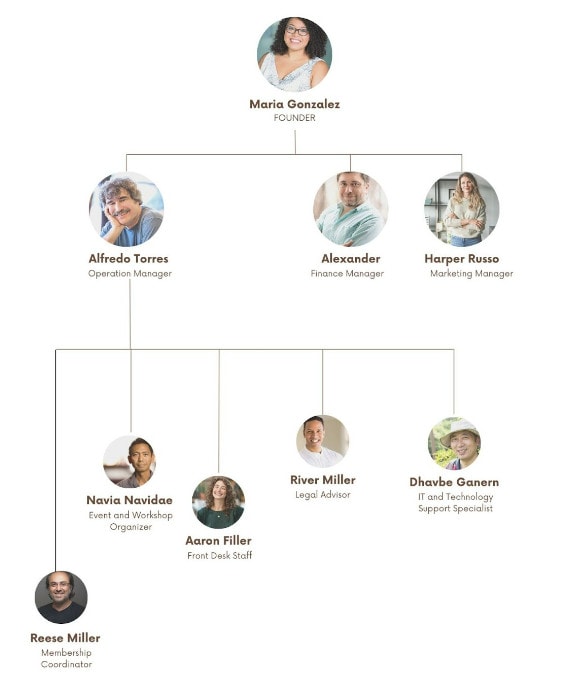
It explains the organizational structure including the hierarchy of reporting relationships, ownership and responsibilities of key management personnel. This also explains how the founder’s past experiences and credentials can help make the business successful.
Founder

Maria Gonzalez is a creative entrepreneur with a love for community building and considerable expertise in company development and workspace management and behind Miami’s newest coworking endeavor. Her career started with a passion for encouraging others to work together and think creatively, which eventually led her into business and volunteering. Maria has the business administration degree and experience, as well as the specific training in workplace design and management, to plan and implement a productive shared office space.
Maria has spent her career participating in a wide range of team-based projects and workplace initiatives, honing her skills in the art of designing spaces that are not only practical but also inspiring and fruitful for their occupants’ work. She is well regarded among Miami’s business elite due to her expert knowledge of the unique challenges faced by sole proprietors, young companies and established SMEs.
In a city like Miami, coworking space is a reflection of her entrepreneurial spirit. She wants to do more than simply let out office space so she’s working to create a community of entrepreneurs that can help each other out. The power of collaboration, making connections and creates a space where both seasoned professionals and newbies may thrive.
At the center of her coworking space is a dedication to quality and innovation. The location is intended to be a center for networking and professional growth thanks to its cutting-edge facilities, adaptable workstations and thriving community vibe.
Positions and Responsibilities
Chief Executive Officer (CEO) – Maria Gonzalez
The major duty of managing the coworking space and determining its long-term direction. Her responsibilities include serving as the principal decision-maker, managing the space’s resources and representing the company at industry events and discussions. Another important part of her job is making sure the board and the operational teams are talking to one other.
Community Manager
The Community Manager is in charge of the general vibe and smooth functioning of the shared office. Essential for fostering member collaboration and productivity, responding to member questions and managing the community’s inbox.
Membership Coordinator
A Membership Coordinator’s main responsibilities are around members: new ones, current ones and the relationships between all of them. New members will have a pleasant onboarding experience and they will get continuing assistance. This function is vital in recognizing and serving the different demands of the coworking community.
Event and Workshop Organizer
This role requires the coordinator to organize and run a variety of workshops and seminars for employee training and networking. The purpose of the Event and Workshop Organizer is to improve the coworking experience and encourage community participation via the creation of interesting, engaging and relevant programming in collaboration with members and external partners.
Front Desk Staff:
A coworking space’s receptionist is often the initial point of contact for members, guests and anybody else with questions about the space.
Organogram
Operational Overview
Services
Flexible Workspace Solutions:
✔️Perfect for today’s entrepreneurs, freelancers and remote workers, state-of-the-art coworking facilities provide ergonomic furniture and lightning-fast internet.
✔️Variety of options including hot desks, dedicated desks and private offices to suit different working styles and needs.
Meeting and Conference Facilities:
✔️Fully-equipped meeting and conference rooms with advanced audio-visual technology, ideal for team meetings, client presentations and video conferencing.
✔️Booking availability for both members and non-members with flexible scheduling options.
Virtual Office Services:
✔️Professional business address for mail and package handling.
✔️Having a professional sounding answering service and office staff may do wonders for a company’s reputation.
Event Spaces and Networking Opportunities:
✔️Versatile event spaces for hosting workshops, seminars and networking events fostering community engagement and professional development.
✔️Meet-ups, talks and other social activities are held often around the community.
Professional Development Programs:
✔️Workshops and seminars focused on skill development, entrepreneurship and business growth.
✔️Collaborations with industry experts and local businesses to provide valuable learning experiences.
Industry Analysis
With a CAGR of 22.4% between 2022 and 2028 the market is expected to rise from its estimated $13.1 billion in 2022 to $50.15 billion in 2028. Number of factors contributing to the expansion of this market including the popularity of the gig economy, the rising expense of conventional office space, the need of adaptability and the pursuit of social interaction.
.
Source: grandviewresearch
Key Trends
Several trends are shaping the coworking space industry in the USA:
✔️Specialization: Tech startups, creative firms and social enterprises are just a few of the sorts of companies that certain coworking spaces cater to.
✔️Technology integration: Coworking spaces are integrating new technologies to improve the experience for its members such as smart building technology, virtual reality and augmented reality.
✔️Amenity expansion: Coworking spaces are providing a greater variety of services such as fitness centers, cafés and event spaces, to attract and maintain members.
✔️Location expansion: Coworking spaces are expanding into new markets including suburban and rural areas, to meet the growing demand for flexible workspaces.
Industry Problems
✔️Limited Space or Overcrowding: When the coworking space is full it might be difficult for customers to concentrate or locate an open desk. During peak times or when many people are competing for few resources like conference rooms this may become a major issue.
✔️Network and Connectivity Issues: Reliable internet is crucial for a coworking space. Customers may experience frustration with intermittent connectivity, slow speeds or technical glitches which can significantly hinder their productivity.
✔️Noise Distractions: Noise is often a major disruption in open offices. This may include loud discussions, phone calls or simply the overall hum of a busy atmosphere making it difficult for certain individuals to focus on their task.
✔️Privacy Concerns: Open floor plans might make customers feel like they have no personal space. Concerns may emerge around the privacy of one’s chats the content shown on one’s display or one’s possessions.
✔️Difficulty in Booking Resources: Members could find it tough to book meeting places or equipment owing to excessive demand or a cumbersome reservation procedure. Those who need them for client meetings or crucial work may find this frustrating.
Industry Opportunities
✔️Expanding or Optimizing Space: It may be necessary to either add square footage or reorganize the current setup in order to accommodate everyone. Space may be used more effectively via the use of hot desking or the inclusion of private rooms. Larger groups and companies may be interested in moving in because of this growth.
✔️Enhanced IT Infrastructure: You may position your shared office as a trustworthy location for in-demand IT work by investing in a strong IT infrastructure to address connection difficulties. Providing members with access to IT support services is another great perk.
✔️Quiet Zones and Soundproofing: Creating designated quiet zones or soundproof booths can address noise distractions. This initiative can attract professionals like podcasters, therapists or anyone needing a quiet environment diversifying your member base.
✔️Enhanced Privacy Solutions: You may make your area more appealing to members who deal with sensitive information by using privacy-focused solutions like privacy screens, safe storage and private phone booths.
✔️Streamlined Booking System: Improving the booking process for available resources may lead to happier members. This may take the form of an intuitive app or website function that enables instantaneous scheduling and alerts.
Target Market Segmentation
Geographic Segmentation
✔️Miami-Dade County Residents: Pay close attention to the local independent workers, sole proprietors and small businesses. This comprises both developing talents in many areas as well as experienced specialists in the field.
✔️Miami Neighborhoods: Target specific neighborhoods like Brickell, Coral Gables or the Miami Design District known for their dynamic business scenes and entrepreneurial communities.
Demographic Segmentation
✔️Age Groups: Consider the demands and preferences of a wide range of employees including recent graduates, mid-career professionals and seasoned businesspeople.
✔️Income Levels: Offer a range of coworking solutions from cost-effective hot desks for budding entrepreneurs to premium private offices for high-income professionals.
✔️Cultural Diversity: Embrace Miami’s multiethnic atmosphere by providing a workplace that is open and accepting of all people.
Psychographic Segmentation
✔️Aspiring Entrepreneurs and Freelancers: Find people who are just starting out in business for themselves or as freelancers and provide them with a safe space to learn, develop and make connections.
✔️Professional Consultants and Remote Workers: Cater to the needs of professionals who require a reliable, well-equipped space for their day-to-day operations.
✔️Creatives Seeking Collaborative Environments: Create an environment that encourages creativity and interaction amongst professionals from different disciplines.
Behavioral Segmentation
✔️Startups and Small Businesses: Focus on small teams and startups looking for a collaborative environment to grow their businesses.
✔️Digital Nomads and Remote Workers: With the increase of remote work, targeting digital nomads and remote workers of bigger organizations may open up a new market area.
✔️Event-Based Workspace Needs: Cater to clients who require meeting spaces for specific events, workshops or team off-sites.
Market Size
✔️Total Addressable Market (TAM) for Coworking Space: The potential clientele for shared office spaces in the United States is included in your coworking space’s Total Addressable Market. Those who work from home those who own small enterprises and those who work for bigger companies that need adaptable workplace options. Given the rise of freelance labor and other forms of flexible employment as well as the general expansion of the job market TAM’s reach is impressive. The total addressable market (TAM) in 2023 is likely to be large due to factors such as technology development, shifting worker demographics and post-pandemic changes in work habits.
✔️Serviceable Addressable Market (SAM) for Coworking Space: The SAM for your shared office space represents a subset of the total addressable market. It’s a measure of how much of the market your coworking space can really attract. Location in Miami where special amenities (such as high-speed internet, meeting rooms and event spaces) and the types of clients you want to attract (digital nomads, local startups or small business teams) are all factors that will affect your SAM. If your business model is geared toward tech startups or delivering high-end facilities to professional consultants your SAM will look different from one that caters to creative freelancers or places a priority on cost-effectiveness.
✔️Serviceable Obtainable Market (SOM) for Coworking Space: Your coworking space might reasonably anticipate to take advantage of the Serviceable Obtainable Market part of the SAM. Because it indicates the share of the market that is within reach given your existing resources, market position and competitive environment this indicator is crucial. The success of your coworking space’s marketing and community-building efforts, the quality of your facilities and services, the efficacy of your operational management and the reputation and brand value of your place all factor into its SOM. The SOM gives you a realistic objective to shoot for in terms of client acquisition, revenue projections and market penetration helping you zero in on and dominate the most lucrative subsets of the coworking industry.
Industry Forces
Market Demand and Workplace Trends:
Changes in how people work have influenced the need for shared office spaces in cities like Miami. A rise in the number of freelancers and startups as well as the popularity of remote work have increased demand for adaptable office space. This has been boosted by developments in virtual collaboration technology. This may be capitalize by welcoming a wide range of customers such as mobile corporate teams, solo professionals and digital nomads.
Competition
Other local coworking spaces as well as regular office leases and home offices also provide competition in the coworking industry. Unique features, community-building events, outstanding service and a focus on certain demographics may help your establishment stand out from the competition. Emphasizing what makes your coworking space stand out from the competition is crucial if you want to build a loyal member base.
Technological Advances
Maintaining compatibility with cutting-edge software and hardware is essential for any contemporary coworking environment. It’s crucial to put money into fast internet, cutting-edge printing and scanning technology and user-friendly ergonomic workplaces. Improving member involvement and streamlining operations via the use of digital technologies including an intuitive website, online booking systems and customer relationship management software.
Regulatory Environment
Verify that all company operations, property laws and safety policies are in accordance with local rules. If you want to run your coworking space legally and effectively, you need also keep up with local zoning regulations and occupancy limits.
Economic Factors
The success of your coworking space may be affected by the economy particularly the state of finances among local firms and independent contractors. The demand for workspace and your capacity to provide it, may be affected by economic fluctuations experienced by your members. Pricing and membership plans that are flexible in response to economic changes can help you weather the storm.
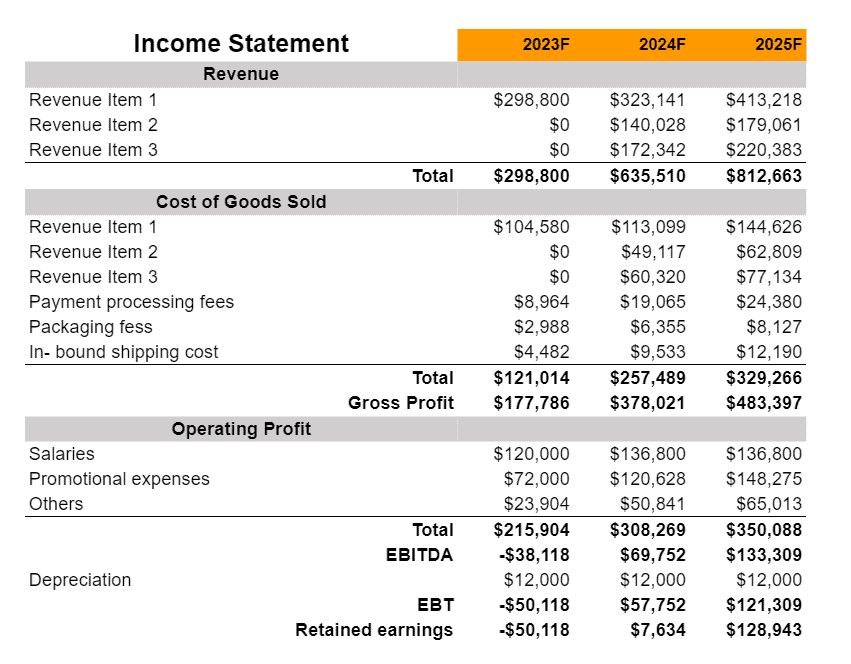
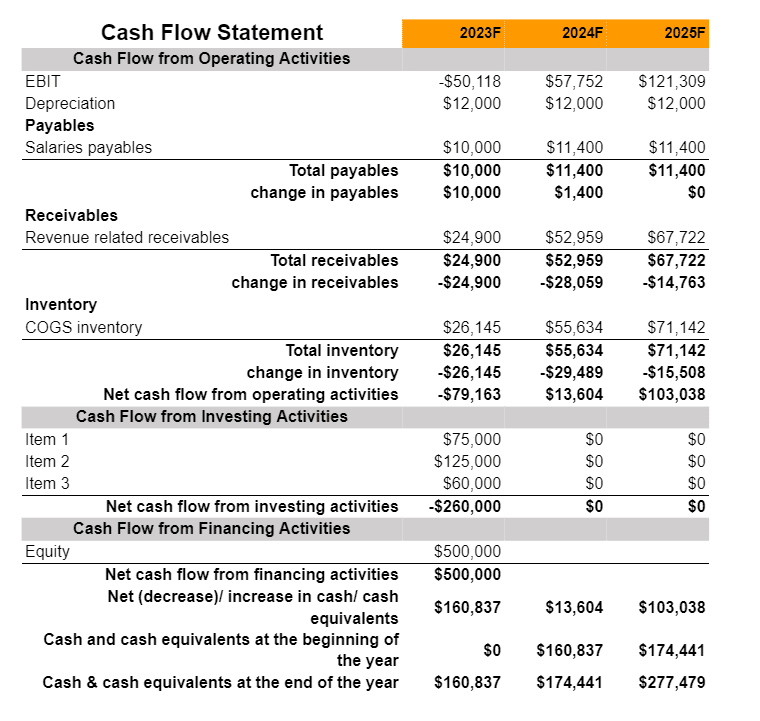
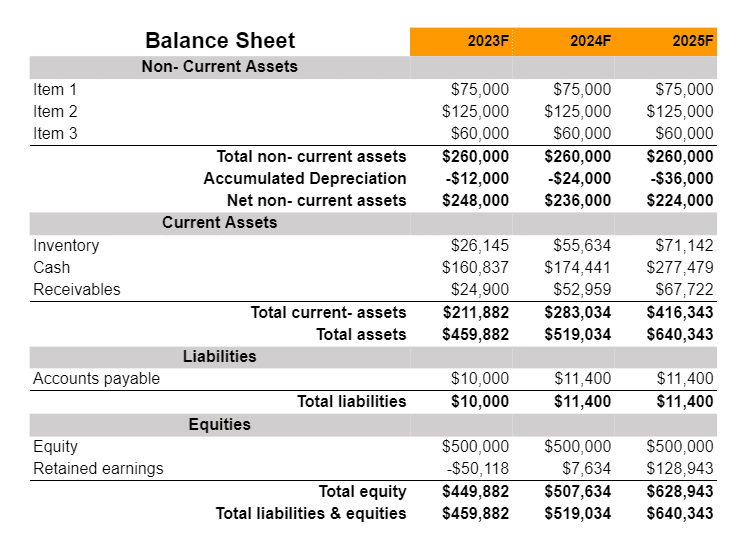
Financial Statements
The financial model has all the important financial statements including Income Statement, Balance Sheet and Cash Flow Statement. In addition, the financial model includes 3 to 5 years of projections and can be edited using Microsoft Excel or Google Sheets.
Income Statement
Cash Flow Statement
Balance Sheet
Revenue Summary
Cost of Goods Sold
Related Articles

