Written by Elma Steven | Updated on April, 2024

If you are planning to write the Screen Printing business plan on your own, then this sample business plan can be great for guidance. However, if you are looking for a professional business plan writer for a business loan, SBA loan or to find out the possibility of success for your new business then let’s talk!
Table of Contents
Executive Summary
Overview: Choice Image, Inc. has dedicated itself to assisting our clients in developing creative, cost-effective, and successful marketing campaigns. Our client’s success reflects our unwavering dedication to their objectives. We have a fully staffed, state-of-the-art screen print/ embroidery & digital direct production facility devoted to providing robust, broad-based solutions to a nationwide audience of retailers and manufacturers. Any producer prioritizes quality. Throughout our production process, we place a high value on quality. To provide our consumers with a low price, we also endeavor to be as efficient as possible.
Mission: State-of-the-art technology and a relentless emphasis on meeting or surpassing our clients’ expectations offer exceptional quality and customer satisfaction.
Vision: Choice Image’s goal is to be known for “Quality Screen Printing.” Our rivals will mimic us as a graphic arts firm.
Industry Overview: The worldwide market for screen printing is expected to increase at a CAGR of 16 percent between 2020 and 2027, from an anticipated US$1.8 billion in 2020 to a revised US$5 billion by 2027. LCDs, one of the report’s sectors, are expected to grow at an 18 percent compound annual growth rate (CAGR) and reach US$1.2 billion by the conclusion of the study period. Following an early assessment of the Covid-19 pandemic’s commercial ramifications and the resulting economic crisis, the RFID Chips segment’s growth has been updated to a revised 18.5 percent CAGR over the following seven years. Check out this guide on how to write an executive summary? If you don’t have the time to write on then you can use this custom Executive Summary Writer to save Hrs. of your precious time.
Financial Overview:

Financials is one of the most important sections of a business plan. You can get an idea of your projected revenue, required investment amount, is the business sustainable without additional funding, etc.
Financial Highlights:
| Liquidity | 2020A | 2021A | 2022F | 2023F | 2024F |
| Current ratio | 6 | 12 | 23 | 32 | 42 |
| Quick ratio | 6 | 11 | 22 | 31 | 40 |
| DSO | 8 | 8 | 8 | 8 | 8 |
| Solvency | | | | | |
| Interest coverage ratio | | | 8.2 | 11.1 | 14.2 |
| Debt to asset ratio | 0.01 | 0.01 | 0.2 | 0.18 | 0.16 |
| Profitability | | | | | |
| Gross profit margin | 51% | 51% | 53% | 53% | 53% |
| EBITDA margin | 12% | 14% | 21% | 22% | 22% |
| Return on asset | 5% | 6% | 13% | 14% | 14% |
| Return on equity | 5% | 6% | 16% | 17% | 17% |
Fund Usage

Business Model Canvas
Tips on Business Model Canvas
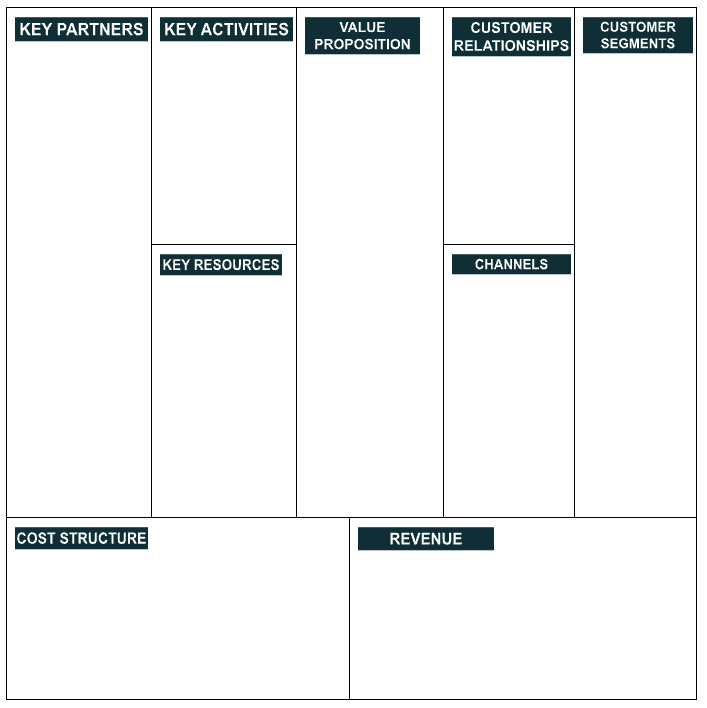
The Business Model Canvas is a high-level overview of the business model. It can also be considered as the business model map in the overall plan. The important partners, key activities, value proposition and cost & revenue sections are only some of the nine vital components. A company idea’s complexities may be mapped out, analyzed and communicated with the use of the canvas. It shows the whole picture of a company’s value creation, delivery and capture processes. It helps new business owners hone their ideas, encourage creative thinking and make sound strategic decisions. It’s a helpful resource for coming up with ideas, organizing plans and presenting business models to key players. Check out the 100 samples of business model canvas.

SWOT
Tips on SWOT Analysis
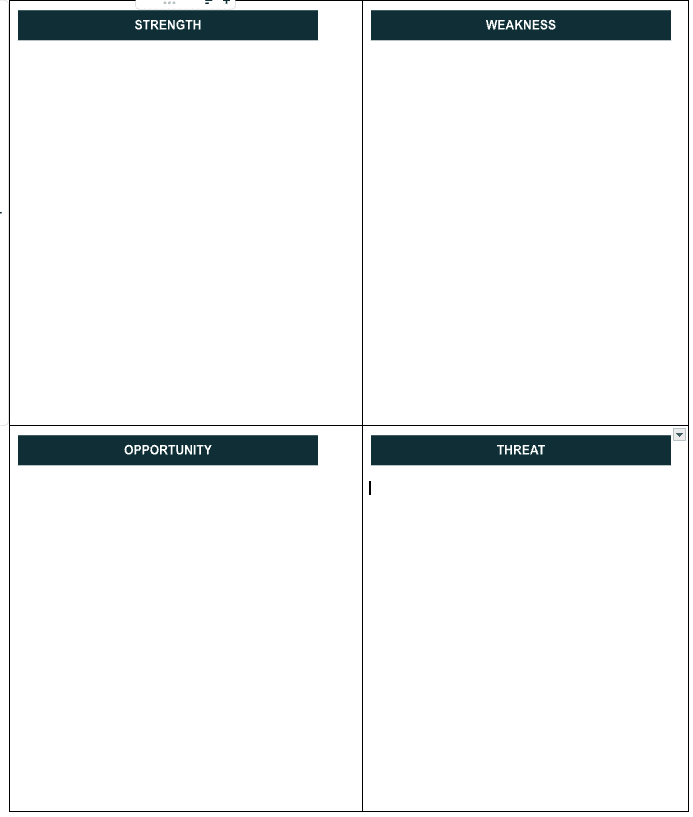
It offers a clear lens into a company’s strengths, weaknesses, opportunities and threats. This self-awareness enables effective resource allocation and strategic positioning against competitors. Businesses can mitigate risks, make informed decisions and set realistic goals. In addition, presenting a SWOT analysis in a business plan communicates to stakeholders that the company possesses a deep understanding of its market environment. In essence, SWOT ensures a business’s strategy is grounded in reality enhancing its chances of success. Check out the 100 SWOT Samples

Industry Analysis
The industry analysis section of the Screen Printing business plan will help you get better insights into competitors, market growth, and overall industry prospects. You can order a custom market research report for your Screen Printing business.
The projected market for screen print labels is estimated to grow at a CAGR of 2.12% during the projected period. (2021-2026). Product security is one of the fastest-growing applications for the screen label process. Microscopic taggants are included in coatings and applied to labels and other packaging items via screen printing. When scanned, such taggants provide private brand information intended to deter counterfeiters. Shortly, the use of product security will increase.
The market prefers this printing method because of its abrasion, moisture resistance, and smooth ink coating. This technique excels in applications that need features such as weather (outdoors), water, abrasion, and chemicals because the ink layer thickness is so suitable. Beverage labels are a good match for this characteristic. Furthermore, screen printing offers the single most significant advantage over all other production printing methods regarding the amount of ink applied to a substrate. UV letterpress can lay down 2 to 3.5 microns of ink, UV offset 1.5 to 2.5 microns, gravure 2 to 5 microns, and UV flexo 3 to 8 microns. The ink thickness on a UV screen, on the other hand, may vary from 4 to 30 microns and beyond. Screen-printed inks have a higher level of opaqueness than inks used in other labeling processes due to the thickness of the ink.
In addition, the market is being driven by screen-printing silicon ink. Ink providers are stepping up to the plate to offer new, upgraded solutions that allow decorators to use their expertise when new fabric becomes available entirely. Silicone inks are based on cutting-edge polymers to provide the best stretch and feel on today’s performance textiles. The inks have been created uniquely to bring the strengths and advantages of silicone chemistry to the textile screen printing process. The trend will shift to greater use of high-density silicone ink for 3D heating press transfer labels in applications other than apparel.
The market’s expansion is hampered by the cost of a multicolor printing solution. A digital printing solution, which is a superior choice for printing with many colors, is another option for saving money. Furthermore, fine text may be difficult to screen print due to the ink’s thickness, but fine images are best printed digitally or flexographically.

Source: coherentmarketinsights
While working on the industry analysis section make sure that you add significant number of stats to support your claims and use proper referencing so that your lender can validate the data.
In the year 2020, the market for screen printing in the United States is expected to be worth US$474.4 million. The world’s second-largest economy, China, is expected to reach a market size of US$1.2 Billion by 2027, which represents a CAGR of 21% between 2020 and 2027. Japan and Canada are two more notable geographic markets, with growth rates of 11.3 percent and 14.2 percent, respectively, predicted for 2020-2027. Germany is expected to expand at a 12.7 percent compound annual growth rate (CAGR) within Europe. The worldwide Sensors sector is expected to grow at a 14.3 percent CAGR, with the United States, Canada, Japan, China, and Europe leading the way. By the end of the study time, these regional markets, which had a combined market value of US$222.8 million in 2020, will have grown to US$566.6 million. China will continue to be the fastest-growing in this group of regional markets. The Asia-Pacific market is expected to reach US$768.7 million by 2027. It is led by nations like India, Australia, and South Korea, while Latin America is expected to grow at a 16.9% CAGR during the same period.
Screen Print Label Market-Growth Rate by Region(2020-2025)

Source: theinsightpartners
The need for screen print label technology has risen with the global garment market’s growing value. Clothing label designers are always coming up with new concepts for clothing labels and unique materials, finishes, and other design strategies. Screen-printed fabric labels for the textile sector acquire exceptional detail on unique, complicated patterns. It’s ideal for baby clothing, tees, and lingerie. Companies use rotary printing and screen printing processes to produce printed satin labels.
Furthermore, there is anxiety in the garment industry, ranging from tariffs to trade agreements to worries about coronaviruses. Republic offered a non-recourse facility of USD 750K to a California fashion producer in March 2020. Knit shirts and screen-printed t-shirts are among the items available via the company’s wholesale division. For the next several years, this will support all of its cycles.
Marketing Plan
A key part of the marketing plan is the marketing budget. The growth in the number of customers is proportional to the budget and dependent on the CAC.

Content Marketing: Create a blog on the website with material catering to prospective customers of Choice Image, Inc.
Discounts: Provide multiple rewards or incentives where Choice Image, Inc. customers get a deal if they successfully recommend someone.
Social Media: Engage and promote on Twitter, publish news on Facebook, and utilize Instagram to promote curated photos of your space and events.
SEO (Search Engine Optimization) Local SEO makes it easier for local consumers to find out what you have to offer. It creates trust with potential members seeking what your place offers.
Email Marketing: Sending automated in-product and website communications to reach out to consumers at the right time. Remember that if your client or target views your email as really important, they are more likely to forward it or share it with others, so include social media share buttons in every email.
Organogram

Financial Plan
This section helps your lender figure out whether you will be able to pay off the loan, whether the business is sustainable, what are the growth prospects, etc.
Earnings:

Break-Even Analysis:

Income Statement:
| | 2020A | 2021A | 2022F | 2023F | 2024F |
| ANNUAL REVENUE | | | | | |
| Item 1 | 9,217 | 59,117 | 175,410 | 415,277 | 781,357 |
| Item 2 | 34,701 | 222,558 | 660,368 | 1,563,394 | 2,941,580 |
| Item 3 | 4,067 | 19,561 | 46,432 | 78,519 | 114,905 |
| Total annual revenue | 47,985 | 301,236 | 882,211 | 2,057,189 | 3,837,842 |
| % increase | | 528% | 193% | 133% | 87% |
| COST of REVENUE | | | | | |
| Item 1 | 360 | 2,259 | 6,617 | 15,429 | 28,784 |
| Item 2 | 480 | 3,012 | 8,822 | 20,572 | 38,378 |
| Item 3 | 52,000 | 65,000 | 78,000 | 91,000 | 104,000 |
| Item 4 | 720 | 3,615 | 8,822 | 16,458 | 23,027 |
| Item 5 | 140,000 | 336,000 | 560,000 | 840,000 | 1,120,000 |
| Item 6 | 60,000 | 144,000 | 240,000 | 360,000 | 480,000 |
| Item 7 | 32,000 | 61,333 | 85,533 | 112,153 | 141,435 |
| Total Cost of Revenue | 285,560 | 615,220 | 987,794 | 1,455,612 | 1,935,625 |
| as % of revenue | 595% | 204% | 112% | 71% | 50% |
| Gross Profit | -237,575 | -313,984 | -105,583 | 601,578 | 1,902,218 |
| SELLING & ADMIN EXPENSES | | | | | |
| Item 1 | 28,000 | 96,800 | 154,880 | 175,692 | 193,261 |
| Item 2 | 75,000 | 105,000 | 120,000 | 120,000 | 120,000 |
| Item 3 | 36,000 | 96,000 | 108,000 | 120,000 | 120,000 |
| Item 4 | 8,000 | 12,000 | 12,000 | 12,000 | 12,000 |
| Item 5 | 3,839 | 18,074 | 44,111 | 61,716 | 115,135 |
| Item 6 | 3,359 | 12,049 | 26,466 | 41,144 | 76,757 |
| Item 7 | 5,600 | 10,000 | 12,904 | 15,034 | 17,376 |
| Item 8 | 6,667 | 14,000 | 22,067 | 30,940 | 40,701 |
| Total selling & admin expenses | 166,464 | 363,924 | 500,428 | 576,525 | 695,230 |
| as % of revenue | 347% | 121% | 57% | 28% | 18% |
| Net profit | -404,039 | -677,907 | -606,011 | 25,052 | 1,206,987 |
| Accumulated net profit | -404,039 | -1,081,947 | -1,687,957 | -1,662,905 | -455,918 |
Cash Flow Statement:
| | 2020A | 2021A | 2022F | 2023F | 2024F |
| CASH FLOW from OPERATING ACTIVITIES | | | | | |
| Net profit before tax | -$404,039 | -$677,907 | -$606,011 | $25,052 | $1,206,987 |
| Depreciation | $44,267 | $85,333 | $120,504 | $158,127 | $199,512 |
| Payables | | | | | |
| Item 1 | $4,333 | $5,417 | $6,500 | $7,583 | $8,667 |
| Item 2 | $11,667 | $28,000 | $46,667 | $70,000 | $93,333 |
| Item 3 | $6,250 | $8,750 | $10,000 | $10,000 | $10,000 |
| Item 4 | $3,000 | $8,000 | $9,000 | $10,000 | $10,000 |
| Item 5 | $667 | $1,000 | $1,000 | $1,000 | $1,000 |
| Total payables | $25,917 | $51,167 | $73,167 | $98,583 | $123,000 |
| change in payables | $25,917 | $25,250 | $22,000 | $25,417 | $24,417 |
| Receivables | | | | | |
| Item 1 | $320 | $1,506 | $3,676 | $5,143 | $9,595 |
| Item 2 | $360 | $1,807 | $4,411 | $8,229 | $11,514 |
| Total receivables | $680 | $3,314 | $8,087 | $13,372 | $21,108 |
| change in receivables | -$680 | -$2,634 | -$4,773 | -$5,285 | -$7,736 |
| Net cash flow from operating activities | -$334,536 | -$569,958 | -$468,280 | $203,311 | $1,423,180 |
| | | | | | |
| CASH FLOW from INVESTING ACTIVITIES | | | | | |
| Item 1 | $16,000 | $13,200 | $14,520 | $15,972 | $17,569 |
| Item 2 | $20,000 | $22,000 | $24,200 | $26,620 | $29,282 |
| Item 3 | $28,000 | $22,000 | $14,520 | $10,648 | $11,713 |
| Item 4 | $96,000 | $88,000 | $72,600 | $79,860 | $87,846 |
| Item 5 | $20,000 | $22,000 | $24,200 | $26,620 | $29,282 |
| Net cash flow/ (outflow) from investing activities | -$180,000 | -$167,200 | -$150,040 | -$159,720 | -$175,692 |
| | | | | | |
| CASH FLOW from FINANCING ACTIVITIES | | | | | |
| Equity | $400,000 | $440,000 | $484,000 | $532,400 | $585,640 |
| Net cash flow from financing activities | $400,000 | $440,000 | $484,000 | $532,400 | $585,640 |
| Net (decrease)/ increase in cash/ cash equivalents | -$114,536 | -$297,158 | -$134,320 | $575,991 | $1,833,128 |
| Cash and cash equivalents at the beginning of the year | – | -$114,536 | -$411,693 | -$546,014 | $29,978 |
| Cash & cash equivalents at the end of the year | -$114,536 | -$411,693 | -$546,014 | $29,978 | $1,863,105 |
Balance Sheet:
| | 2020A | 2021A | 2022F | 2023F | 2024F |
| NON-CURRENT ASSETS | | | | | |
| Item 1 | $16,000 | $29,200 | $43,720 | $59,692 | $77,261 |
| Item 2 | $20,000 | $42,000 | $66,200 | $92,820 | $122,102 |
| Item 3 | $28,000 | $50,000 | $64,520 | $75,168 | $86,881 |
| Item 4 | $96,000 | $184,000 | $256,600 | $336,460 | $424,306 |
| Item 5 | $20,000 | $42,000 | $66,200 | $92,820 | $122,102 |
| Total | $180,000 | $347,200 | $497,240 | $656,960 | $832,652 |
| Accumulated depreciation | $44,267 | $129,600 | $250,104 | $408,231 | $607,743 |
| Net non-current assets | $135,733 | $217,600 | $247,136 | $248,729 | $224,909 |
| | | | | | |
| CURRENT ASSETS | | | | | |
| Cash | -$114,536 | -$411,693 | -$546,014 | $29,978 | $1,863,105 |
| Accounts receivables | $680 | $3,314 | $8,087 | $13,372 | $21,108 |
| Total current assets | -$113,856 | -$408,380 | -$537,927 | $43,349 | $1,884,214 |
| Total Assets | $21,878 | -$190,780 | -$290,791 | $292,078 | $2,109,122 |
| | | | | | |
| LIABILITIES | | | | | |
| Account payables | $25,917 | $51,167 | $73,167 | $98,583 | $123,000 |
| Total liabilities | $25,917 | $51,167 | $73,167 | $98,583 | $123,000 |
| | | | | | |
| EQUITIES | | | | | |
| Owner’s equity | $400,000 | $840,000 | $1,324,000 | $1,856,400 | $2,442,040 |
| Accumulated net profit | -$404,039 | -$1,081,947 | -$1,687,957 | -$1,662,905 | -$455,918 |
| Total equities | -$4,039 | -$241,947 | -$363,957 | $193,495 | $1,986,122 |
| Total liabilities & equities | $21,878 | -$190,780 | -$290,791 | $292,078 | $2,109,122 |

