Written by Elma Steven | Updated on April, 2024
If you are planning to write the Banquet hall business plan on your own, then this sample business plan can be great for guidance. However, if you are looking for a professional business plan writer for a business loan, SBA loan or to find out the possibility of success for your new business then let’s talk!
In order to write a Business Plan you need to start with executive summary. In order to write an executive summary for a Plan you need to mention- what your business is about and what you’ll sell. Explain how you’ll get people to buy it. The executive summary should be written at the end. Then you should write a Business Description mentioning goals, objectives, mission and vision. Some of the major sections or components involves Fund Usage Plan, Marketing Plan, Industry Analysis, Organizational Overview, Operational Overview and Financials.
This article will provide you a step by step process to write your Business Plan. Get a free Business Plan at the end!
Executive Summary
Overview: The Star Banquet and Event Center in Irving, Texas, services the Dallas/Fort Worth Metroplex and offers a luxurious ballroom for any occasion. Weddings, anniversaries, birthday parties, graduations, business, cultural events, and more are all held at the facility, offering an inspirational and magnificent ambiance. Your guests will have an amazing occasion in our ballroom. Selecting Star Banquet and Event Center makes a bold statement. It claims that you have chosen elegance at a low cost.
Mission: To create an extraordinary setting and deliver excellent services for events.
Vision: Through originality, quality, and undivided devotion, we strive to be the greatest entertainment venue and provide exceptional services to our clients for all of their events.
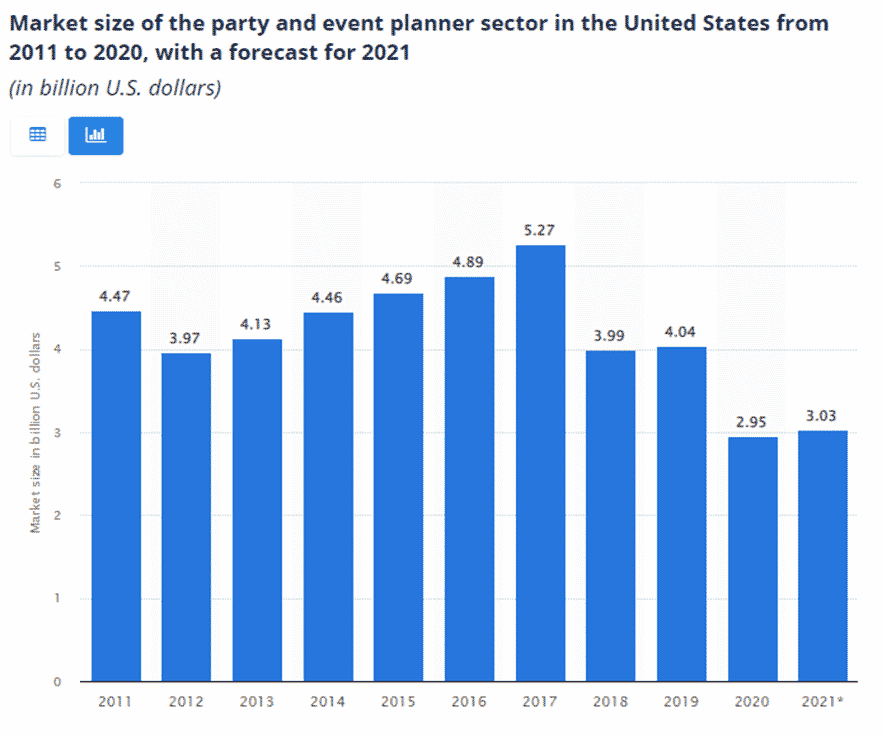
Industry Overview: Although the COVID-19 epidemic had a significant effect on the event-management sector, experts predict strong growth in the following years for event planners. The events sector was worth $1.1354 trillion in 2019 and worth $1.5529 trillion by 2028. For the years 2021 to 2028, the CAGR will be 11.2 percent. In 2020, the US market for party and event planners was 2.95 billion dollars, down from 4.04 billion dollars. This industry is expected to grow to $3.03 billion in 2021. Check out this guide on how to write an executive summary? If you don’t have the time to write on then you can use this custom Executive Summary Writer to save Hrs. of your precious time.
Financial Overview:
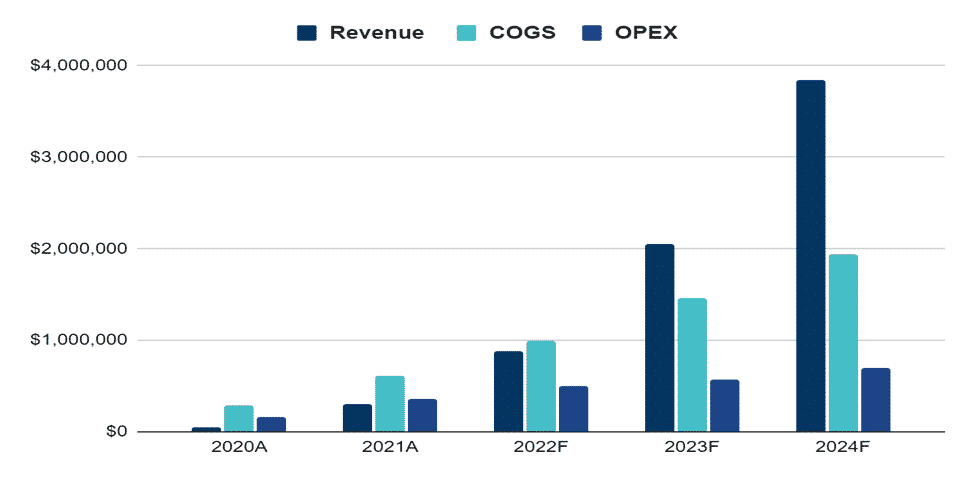
Financials is one of the most important sections of a business plan. You can get an idea of your projected revenue, required investment amount, is the business sustainable without additional funding, etc.
Financial Highlights:
| Liquidity | 2020A | 2021A | 2022F | 2023F | 2024F |
| Current ratio | 6 | 12 | 23 | 32 | 42 |
| Quick ratio | 6 | 11 | 22 | 31 | 40 |
| DSO | 8 | 8 | 8 | 8 | 8 |
| Solvency | |||||
| Interest coverage ratio | 8.2 | 11.1 | 14.2 | ||
| Debt to asset ratio | 0.01 | 0.01 | 0.2 | 0.18 | 0.16 |
| Profitability | |||||
| Gross profit margin | 51% | 51% | 53% | 53% | 53% |
| EBITDA margin | 12% | 14% | 21% | 22% | 22% |
| Return on asset | 5% | 6% | 13% | 14% | 14% |
| Return on equity | 5% | 6% | 16% | 17% | 17% |
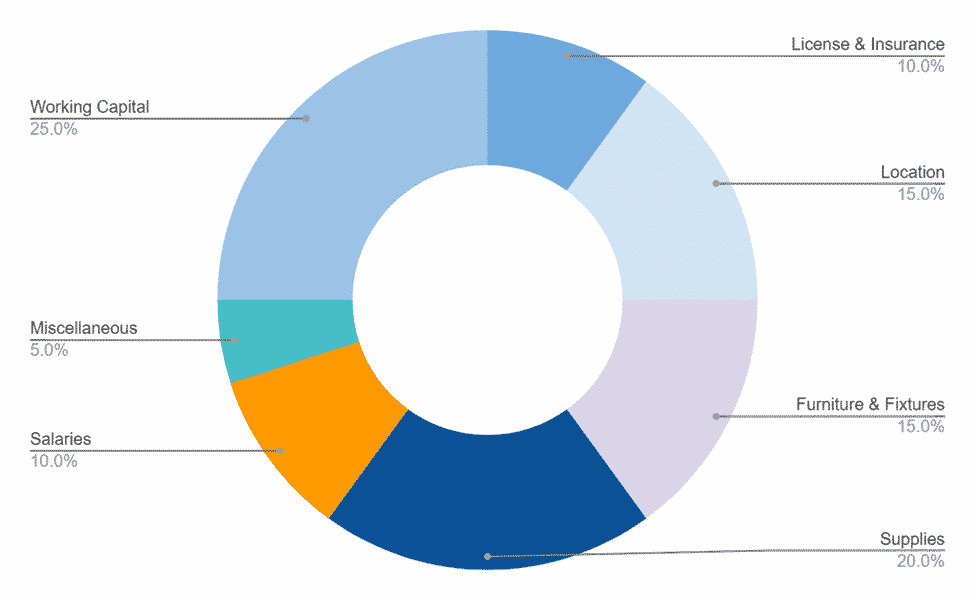
FUND USAGE
Business Model Canvas
Tips on Business Model Canvas
The Business Model Canvas is a high-level overview of the business model. It can also be considered as the business model map in the overall plan. The important partners, key activities, value proposition and cost & revenue sections are only some of the nine vital components. A company idea’s complexities may be mapped out, analyzed and communicated with the use of the canvas. It shows the whole picture of a company’s value creation, delivery and capture processes. It helps new business owners hone their ideas, encourage creative thinking and make sound strategic decisions. It’s a helpful resource for coming up with ideas, organizing plans and presenting business models to key players. Check out the 100 samples of business model canvas.

SWOT
Tips on SWOT Analysis
It offers a clear lens into a company’s strengths, weaknesses, opportunities and threats. This self-awareness enables effective resource allocation and strategic positioning against competitors. Businesses can mitigate risks, make informed decisions and set realistic goals. In addition, presenting a SWOT analysis in a business plan communicates to stakeholders that the company possesses a deep understanding of its market environment. In essence, SWOT ensures a business’s strategy is grounded in reality enhancing its chances of success. Check out the 100 SWOT Samples

Industry Analysis
The industry analysis section of the Banquet hall business plan will help you get better insights into competitors, market growth, and overall industry prospects. You can order a custom market research report for your Banquet hall business.
Households and companies’ willingness to spend money on social events is critical to the Party and Event Planning sector. Businesses engage event planners to help them arrange Christmas dinners, fundraisers, and client appreciation events, among other things. Similarly, weddings, anniversaries, birthdays, and other milestone festivities are organized and promoted by homes in collaboration with professional event planners. As a result, the significant drivers of demand from the household market are per capita disposable income and consumer confidence levels. Strong business morale and consumer confidence have bolstered demand for event planners in residential and corporate industries throughout the five years leading up to 2019. Over the next five years, the revenue in the sector is expected to increase. The Party and Event Planners market is predicted to stagnate during the next five years through 2024. While favorable macroeconomic circumstances will keep industry revenue afloat, slowing family income and company profit growth will cause revenue growth to slow significantly in comparison to the preceding five years.
This sector comprises small firms and people that plan parties, weddings, corporate dinners, and other social occasions for individuals, corporations, and organizations. The internal event planning divisions of hotels, conference centers, and recreational facilities are not included in this business, nor are firms that arrange conferences, trade exhibitions, or athletic events. Large-scale private, public and corporate events may be daunting when too many details for a few individuals to handle. It’s no surprise that the event management sector is so large, given the number of people, organizations, and corporations that support such events. There’s a lot more in event planning than picking a location, catering, and entertainment; you also have to deal with technical issues, themes, marketing, etc.
This sector comprises small firms and people that plan parties, weddings, corporate dinners, and other social occasions for individuals, corporations, and organizations. The internal event planning divisions of hotels, conference centers, and recreational facilities are not included in this business, nor are firms that arrange conferences, trade exhibitions, or athletic events.
Source: smallbusiness
While working on the industry analysis section make sure that you add significant number of stats to support your claims and use proper referencing so that your lender can validate the data.
Companies and people that arrange social events, such as corporate fundraisers, weddings, and birthday parties, are part of the Party and Event Planners business. Venue booking, music arrangements, food catering, photography, video recording, and other services are just a few aspects that industry players coordinate for parties and events. The planner or a planner representative is often present throughout the event to ensure that everything works properly. The industry’s income is closely associated with macroeconomic performance since it provides highly discretionary services.
In 2022, the Party & Event Planners sector will have a market size of $3.2 billion, as measured by revenue, and the industry of Party and Event Planners is predicted to grow by 4%. Between 2017 and 2022, the US market for Party & Event Planners shrank by 9.8%. In the United States, the market for Party & Event Planners shrank faster than the real economy. In the United States, the demand for Party & Event Planners shrank faster than in the Consumer Goods and Services sector. Low entry barriers are the most significant negative factor impacting this business, whereas leisure and sports time is the most important good element. Corporate profit reflects a corporation’s capacity to spend money on holiday parties, workplace picnics, and other social events that need expert event planning services. More profit allows firms to spend more money on events, resulting in increased revenue and profit for the sector. In 2021, corporate profits were predicted to rise, giving the industry a chance to grow.
Many companies have been impacted by shelter-in-place orders and physical barriers imposed in response to the worldwide COVID-19 outbreak. COVID-19 has had an important influence on the events business since social distancing and stay-at-home directives have put capacity and etiquette restrictions on gatherings. Corporate event planners have a different experience than party and wedding planners when it comes to adapting to shifting situations. Due to travel limitations, most corporate events have been canceled, postponed, or adapted. Many event planners have found success with virtual event management because of the advancements in technology. According to a poll conducted by the Professional Convention Management Association, planners’ digital abilities have little influence on their careers.
Due to travel, venue closures, and event capacity constraints, parties and weddings have sometimes had to be canceled or postponed. Thus was created the “Zoom Wedding was.” People may have qualms about attending big gatherings even if businesses reopen or current limitations are eased. As of 2022, the United States has 61,047 Party & Event Planners enterprises, a decrease of -14.3 percent from 2021. Over the five years between 2017 to 2022, the number of enterprises in the Party & Event Planners sector in the United States has decreased by 14.3% each year on average.
The states with the most Party & Event Planners businesses are Florida (2,208 companies), California (2,154 companies), and Texas (1,262 companies). In the United States, the Party & Event Planners sector is labor-intensive, meaning enterprises rely on labor rather than capital. Wages (25.6%), Purchases (21.1%), and Rent & Utilities (21.1%) are the most significant expenses for businesses in the Party & Event Planners category in the US as a proportion of sales (3.5 percent ). There is no company with more than a 5% market share in the Party & Event Planners business in the United States. (planbuildr)
Marketing Plan
A key part of the marketing plan is the marketing budget. The growth in the number of customers is proportional to the budget and dependent on the CAC.
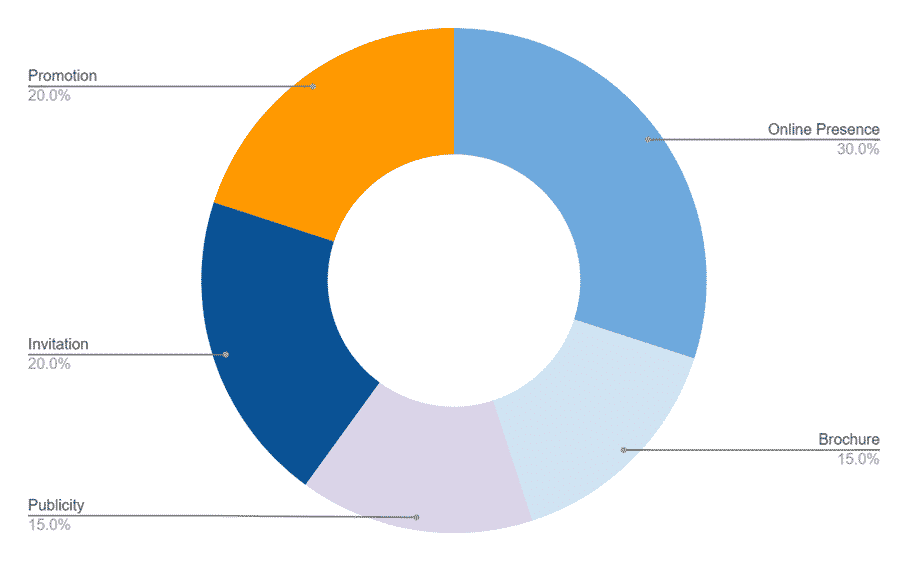
Online Presence: The Star Banquet and Event Center website provide images of the banquet hall to make it easy for potential clients to choose your venue as a finalist. This includes photos of the rooms and information on their size and capacity for various configurations.
Brochure: A four-color brochure may seem outdated, but it is an effective way to promote The Star Banquet and Event Center. We provide photos from a variety of occasions.
Publicity: Giving back to the community by hosting a charity or fundraiser for a small price or possibly simply for the cost and preparation of the meal. It’s also a chance for The Star Banquet and Event Center to get positive exposure.
Invitation: Corporations and businesses are ideal customers for weekday and nighttime events when our banquet hall is likely empty. Invite area company owners and CEOs to see your location and get your brochure.
Promotion: Wedding receptions are the backbone of the banquet hall company. The Star Banquet and Event Center will be promoting days other than Saturdays for weddings. Offer discounts for weddings hosted on other days of the week, and inform brides-to-be and your referral network that scheduling the event on different days and times will save them money.
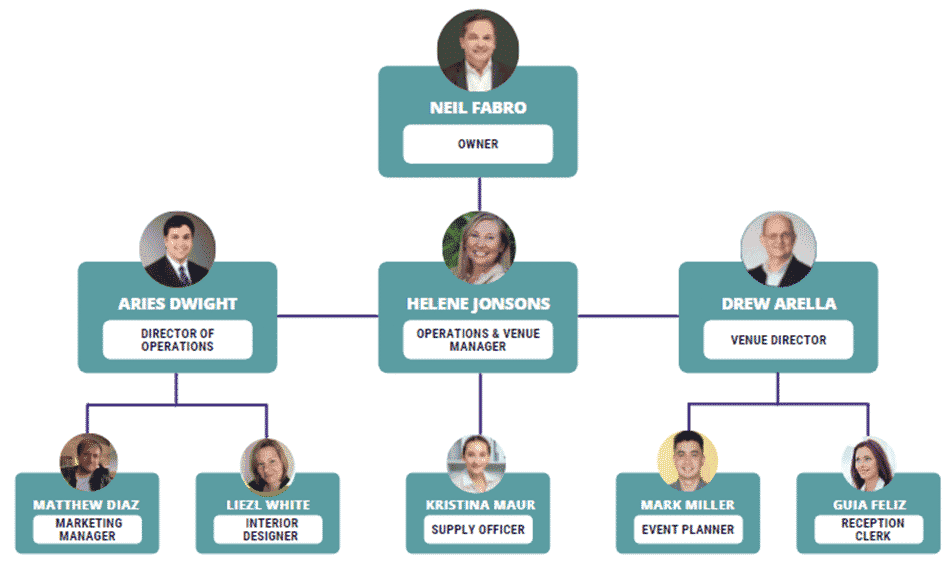
Organogram:
Financial Plan
This section helps your lender figure out whether you will be able to pay off the loan, whether the business is sustainable, what are the growth prospects, etc.
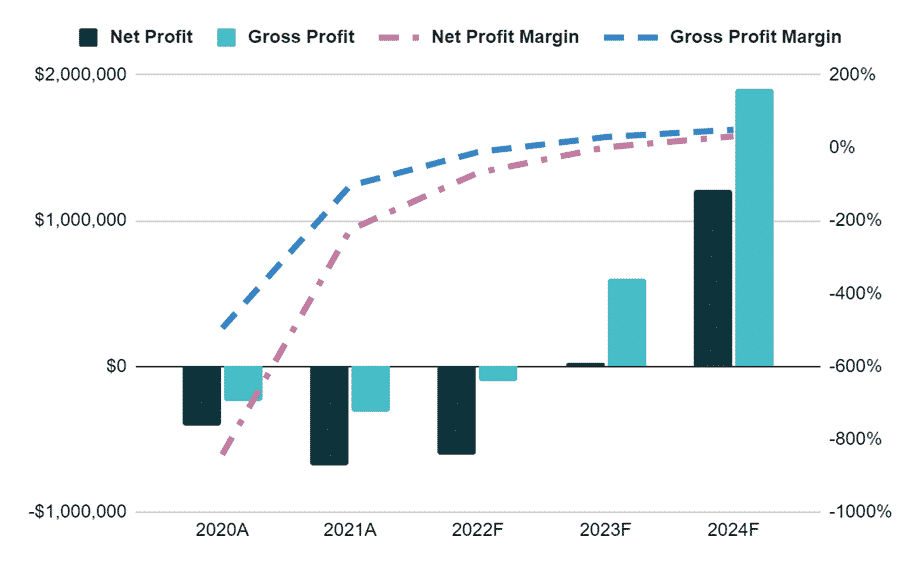
Earnings:
Break-Even Analysis:
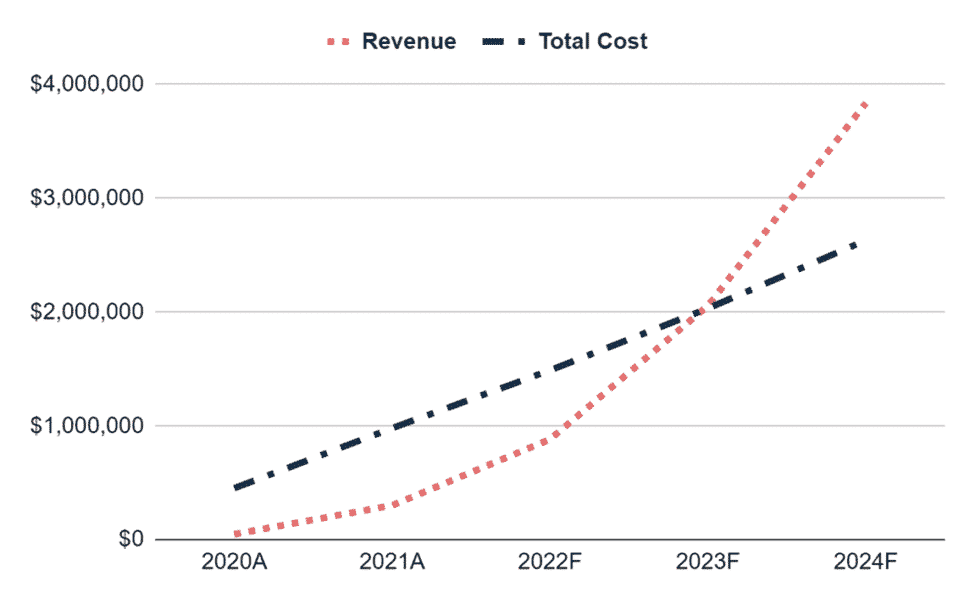
Income Statement:
| 2020A | 2021A | 2022F | 2023F | 2024F | |
| ANNUAL REVENUE | |||||
| Item 1 | 9,217 | 59,117 | 175,410 | 415,277 | 781,357 |
| Item 2 | 34,701 | 222,558 | 660,368 | 1,563,394 | 2,941,580 |
| Item 3 | 4,067 | 19,561 | 46,432 | 78,519 | 114,905 |
| Total annual revenue | 47,985 | 301,236 | 882,211 | 2,057,189 | 3,837,842 |
| % increase | 528% | 193% | 133% | 87% | |
| COST of REVENUE | |||||
| Item 1 | 360 | 2,259 | 6,617 | 15,429 | 28,784 |
| Item 2 | 480 | 3,012 | 8,822 | 20,572 | 38,378 |
| Item 3 | 52,000 | 65,000 | 78,000 | 91,000 | 104,000 |
| Item 4 | 720 | 3,615 | 8,822 | 16,458 | 23,027 |
| Item 5 | 140,000 | 336,000 | 560,000 | 840,000 | 1,120,000 |
| Item 6 | 60,000 | 144,000 | 240,000 | 360,000 | 480,000 |
| Item 7 | 32,000 | 61,333 | 85,533 | 112,153 | 141,435 |
| Total Cost of Revenue | 285,560 | 615,220 | 987,794 | 1,455,612 | 1,935,625 |
| as % of revenue | 595% | 204% | 112% | 71% | 50% |
| Gross Profit | -237,575 | -313,984 | -105,583 | 601,578 | 1,902,218 |
| SELLING & ADMIN EXPENSES | |||||
| Item 1 | 28,000 | 96,800 | 154,880 | 175,692 | 193,261 |
| Item 2 | 75,000 | 105,000 | 120,000 | 120,000 | 120,000 |
| Item 3 | 36,000 | 96,000 | 108,000 | 120,000 | 120,000 |
| Item 4 | 8,000 | 12,000 | 12,000 | 12,000 | 12,000 |
| Item 5 | 3,839 | 18,074 | 44,111 | 61,716 | 115,135 |
| Item 6 | 3,359 | 12,049 | 26,466 | 41,144 | 76,757 |
| Item 7 | 5,600 | 10,000 | 12,904 | 15,034 | 17,376 |
| Item 8 | 6,667 | 14,000 | 22,067 | 30,940 | 40,701 |
| Total selling & admin expenses | 166,464 | 363,924 | 500,428 | 576,525 | 695,230 |
| as % of revenue | 347% | 121% | 57% | 28% | 18% |
| Net profit | -404,039 | -677,907 | -606,011 | 25,052 | 1,206,987 |
| Accumulated net profit | -404,039 | -1,081,947 | -1,687,957 | -1,662,905 | -455,918 |
Cash Flow Statement:
| 2020A | 2021A | 2022F | 2023F | 2024F | |
| CASH FLOW from OPERATING ACTIVITIES | |||||
| Net profit before tax | -$404,039 | -$677,907 | -$606,011 | $25,052 | $1,206,987 |
| Depreciation | $44,267 | $85,333 | $120,504 | $158,127 | $199,512 |
| Payables | |||||
| Item 1 | $4,333 | $5,417 | $6,500 | $7,583 | $8,667 |
| Item 2 | $11,667 | $28,000 | $46,667 | $70,000 | $93,333 |
| Item 3 | $6,250 | $8,750 | $10,000 | $10,000 | $10,000 |
| Item 4 | $3,000 | $8,000 | $9,000 | $10,000 | $10,000 |
| Item 5 | $667 | $1,000 | $1,000 | $1,000 | $1,000 |
| Total payables | $25,917 | $51,167 | $73,167 | $98,583 | $123,000 |
| change in payables | $25,917 | $25,250 | $22,000 | $25,417 | $24,417 |
| Receivables | |||||
| Item 1 | $320 | $1,506 | $3,676 | $5,143 | $9,595 |
| Item 2 | $360 | $1,807 | $4,411 | $8,229 | $11,514 |
| Total receivables | $680 | $3,314 | $8,087 | $13,372 | $21,108 |
| change in receivables | -$680 | -$2,634 | -$4,773 | -$5,285 | -$7,736 |
| Net cash flow from operating activities | -$334,536 | -$569,958 | -$468,280 | $203,311 | $1,423,180 |
| CASH FLOW from INVESTING ACTIVITIES | |||||
| Item 1 | $16,000 | $13,200 | $14,520 | $15,972 | $17,569 |
| Item 2 | $20,000 | $22,000 | $24,200 | $26,620 | $29,282 |
| Item 3 | $28,000 | $22,000 | $14,520 | $10,648 | $11,713 |
| Item 4 | $96,000 | $88,000 | $72,600 | $79,860 | $87,846 |
| Item 5 | $20,000 | $22,000 | $24,200 | $26,620 | $29,282 |
| Net cash flow/ (outflow) from investing activities | -$180,000 | -$167,200 | -$150,040 | -$159,720 | -$175,692 |
| CASH FLOW from FINANCING ACTIVITIES | |||||
| Equity | $400,000 | $440,000 | $484,000 | $532,400 | $585,640 |
| Net cash flow from financing activities | $400,000 | $440,000 | $484,000 | $532,400 | $585,640 |
| Net (decrease)/ increase in cash/ cash equivalents | -$114,536 | -$297,158 | -$134,320 | $575,991 | $1,833,128 |
| Cash and cash equivalents at the beginning of the year | – | -$114,536 | -$411,693 | -$546,014 | $29,978 |
| Cash & cash equivalents at the end of the year | -$114,536 | -$411,693 | -$546,014 | $29,978 | $1,863,105 |
Balance Sheet:
| 2020A | 2021A | 2022F | 2023F | 2024F | |
| NON-CURRENT ASSETS | |||||
| Item 1 | $16,000 | $29,200 | $43,720 | $59,692 | $77,261 |
| Item 2 | $20,000 | $42,000 | $66,200 | $92,820 | $122,102 |
| Item 3 | $28,000 | $50,000 | $64,520 | $75,168 | $86,881 |
| Item 4 | $96,000 | $184,000 | $256,600 | $336,460 | $424,306 |
| Item 5 | $20,000 | $42,000 | $66,200 | $92,820 | $122,102 |
| Total | $180,000 | $347,200 | $497,240 | $656,960 | $832,652 |
| Accumulated depreciation | $44,267 | $129,600 | $250,104 | $408,231 | $607,743 |
| Net non-current assets | $135,733 | $217,600 | $247,136 | $248,729 | $224,909 |
| CURRENT ASSETS | |||||
| Cash | -$114,536 | -$411,693 | -$546,014 | $29,978 | $1,863,105 |
| Accounts receivables | $680 | $3,314 | $8,087 | $13,372 | $21,108 |
| Total current assets | -$113,856 | -$408,380 | -$537,927 | $43,349 | $1,884,214 |
| Total Assets | $21,878 | -$190,780 | -$290,791 | $292,078 | $2,109,122 |
| LIABILITIES | |||||
| Account payables | $25,917 | $51,167 | $73,167 | $98,583 | $123,000 |
| Total liabilities | $25,917 | $51,167 | $73,167 | $98,583 | $123,000 |
| EQUITIES | |||||
| Owner’s equity | $400,000 | $840,000 | $1,324,000 | $1,856,400 | $2,442,040 |
| Accumulated net profit | -$404,039 | -$1,081,947 | -$1,687,957 | -$1,662,905 | -$455,918 |
| Total equities | -$4,039 | -$241,947 | -$363,957 | $193,495 | $1,986,122 |
| Total liabilities & equities | $21,878 | -$190,780 | -$290,791 | $292,078 | $2,109,122 |

