Written by Elma Steven | Updated on June, 2024

How to Write a Bookstore Business Plan?
Bookstore Business Plan is an outline of your overall Bookstore business. The business plan includes a 5 year projection, marketing plan, industry analysis, organizational overview, operational overview and finally the executive summary. Remember to write your executive summary at the end as it is considered as a snapshot of the overall business plan. The creation of a plan requires careful consideration of various factors that might impact the business’s success.
Table of Contents
Executive Summary
Overview: The Hockessin BookShelf was founded in 2002 and is a new and used bookshop in Hockessin, Delaware. With 826 square feet of inventory space, The BookShelf is a little marvel, much like our state. We have a wide variety of books, with fiction, mystery, romance, and children’s books being our most popular categories. We love books, and our reading habits are broad, spanning everything from genres to classics, biographies, and children’s books at the Hockessin BookShelf. Summer reading, book clubs, and fun in-store promotions have all been popular at our shop.
Mission: We give many books and continuing literacy assistance to families and their children beginning at birth. We serve as a model for communities to ensure that children become lifelong readers and learners.
Vision: Our aim is for a future where reading, learning, and access to information are valued as rights rather than privileges, allowing all children to flourish.
Industry Overview: As of 2023, the bookstore industry is adapting to the evolving landscape of the digital age, with a market value estimated at around $12 billion in the United States. Despite the rise of e-books and online retailers, there has been a resurgence in the popularity of physical books, with a reported 2.5% annual growth in sales. Independent bookstores have seen a revival, capitalizing on consumer preferences for local, curated experiences and personalized service. Additionally, the integration of cafes, event spaces, and community-focused activities in bookstores has become a key trend, driving foot traffic and diversifying revenue streams.
Check out this guide on how to write an executive summary? If you don’t have the time to write on then you can use this custom Executive Summary Writer to save Hrs. of your precious time.
Financial Overview:

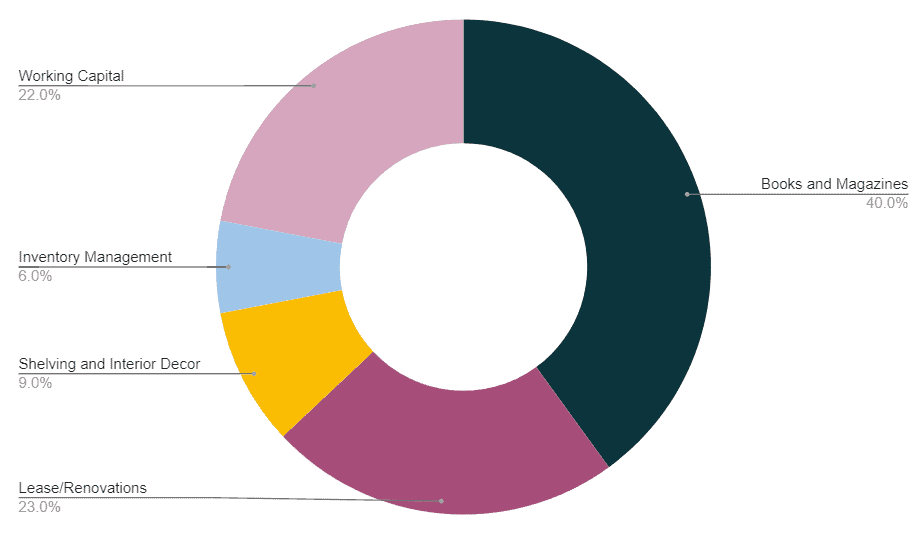
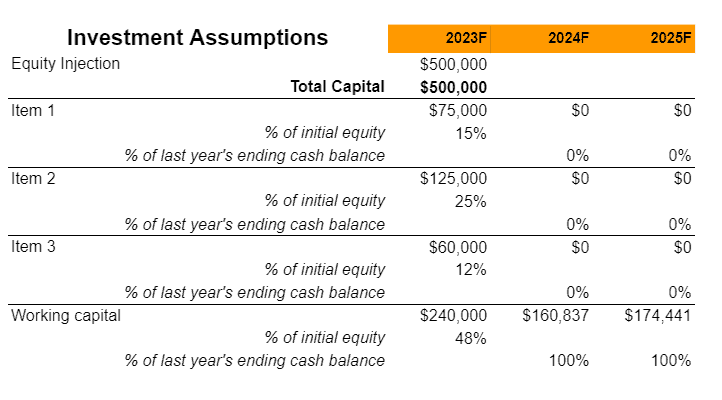
FUND USAGE
Business Model Canvas
Check out the 100 samples of business model canvas.

SWOT
Check out the 100 SWOT Samples

Industry Analysis
The global market for bookstores has been fluctuating, with a recent resurgence in consumer interest in physical books. As of 2023, the industry is valued at approximately $12 billion. There’s been a growing trend towards a preference for physical books over e-books among certain demographics, particularly among young adults and older readers. This preference is partly driven by the tactile experience of physical books and the desire for a break from digital screens. Independent bookstores have seen a revival, with their number increasing by about 35% in the past five years. These stores often serve as community hubs, offering a personalized shopping experience, events, and a curated selection that can’t be replicated online..
The rise of online retailers, particularly giants like Amazon, has posed a significant challenge to traditional brick-and-mortar bookstores. This competition has forced many bookstores to innovate. Many have adopted multi-channel retail strategies, combining in-store experiences with online sales platforms. This approach allows them to reach a broader audience and offer convenience to customers who prefer shopping online. Additionally, bookstores are increasingly using social media for marketing, engaging customers through platforms like Instagram and Twitter, where they can showcase new arrivals, host virtual events, and build a community of readers.
The future of the bookstore industry hinges on its ability to adapt and innovate. Sustainability is becoming a key consideration, with stores implementing eco-friendly practices like sourcing books from local publishers, selling second-hand books, and reducing waste. There’s also a growing trend of bookstores diversifying their offerings to include items like stationery, art supplies, and local crafts, as well as hosting events like book signings, readings, and workshops. This diversification helps bookstores to become lifestyle destinations rather than just retail outlets. The industry’s survival will depend on its ability to maintain the charm and appeal of physical book browsing while embracing new technologies and changing consumer habits.
Net revenue of the book publishing industry in the United States
from 2008 to 2020(in billion U.S. dollars)

Source: planbuildr
The book publishing sector in the United States is expected to bring in $25.71 billion in net revenue in 2020. Although this is a modest decline from the previous year, income stays consistent and is an improvement over the number for 2018.
After more than a decade of losing sales, the Book Stores business has consistently battled to enter a new chapter. Industry revenue is falling even as consumer expenditures and disposable income per capita rise. The sector has been harmed by increased competition from internet shops and big-box retailers. Traditional retail locations have also been pressured as e-books have become a widely recognized medium. Industry income is predicted to drop by 6.3 percent annually to $9.3 billion in the five years leading to 2021. Industrial revenue fell by 10% in 2020 due to the temporary closure of industry operators.
Trade books, magazines, paperbacks, and religious literature are all sold by companies in this business. Domestic and, in certain situations, foreign producers and distributors are used to get these items. The operators subsequently sell these commodities to the general public at industrial shops. This business does not include retailers specializing in derivative products, electronic shopping, or mail-order houses.
Book store sales in the United States
from 1992 to 2021(in billion U.S. dollars)

Source: ibisworld
According to PR Newswire, the worldwide book industry is predicted to rebound and increase at a CAGR of 2% from 2021 to reach $91.4 billion in 2023. The biggest region, Asia-Pacific, accounts for 34% of the worldwide book publishers market in 2019, followed by North America, which accounts for 34% of the global book publishers market in 2019.
Roughly 6,500 businesses (single-location enterprises and units of multi-location corporations) make up the US bookshop sector, which generates about $10 billion in yearly sales.
There has been a lot of conjecture about the collapse of the American bookshop over the last several decades, and some of it isn’t wholly unjustified. How can tiny local shops expect to thrive while large brands like Borders succumb to internet sellers, e-books, and other types of electronic entertainment? While the situation for booksellers in the United States is not ideal, it is not as terrible as it seems. Despite the print media’s catastrophic forecasts, Americans continue to read many books and spend billions of dollars on them each year. Even though a significant portion of book sales now take place online, many small and big bookshops continue to make good money. There’s a lot of opportunity for improvement, but it’s not all doom and gloom for booksellers in the United States.
The coronavirus pandemic might have devastating long-term consequences for booksellers. Sales will be lost to online bookstores, notably Amazon, due to consumer shop closures and social alienation, which the sector has been combating for decades. COVID-19 will almost certainly hasten bookstore sales decreases. In March 2020, bookshop sales decreased by more than 33% and were down more than 11% this year compared to the first quarter of 2019. Major bookstore chains, in particular, have been targeted.
Marketing Plan
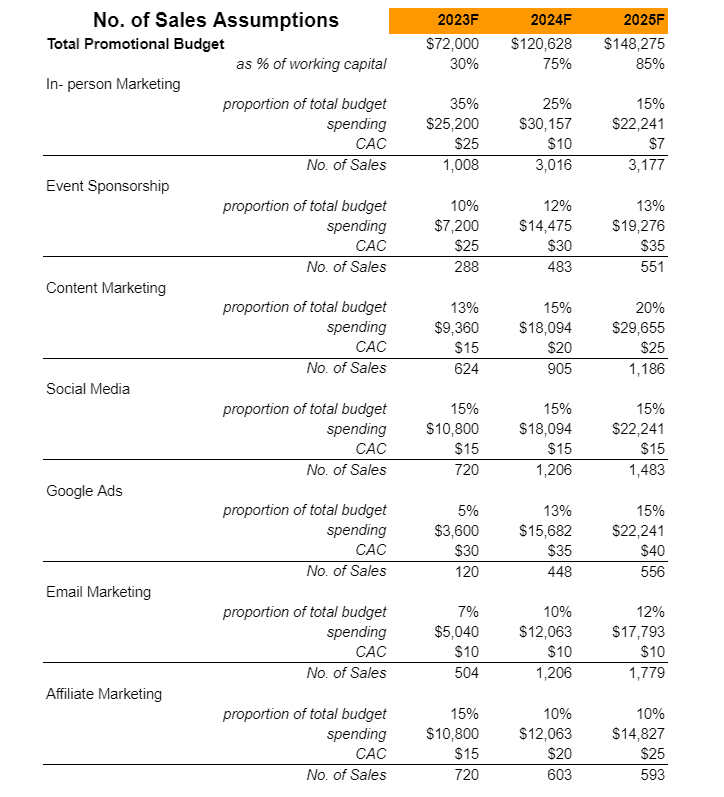
A marketing plan outlines the company’s strategy to promote its products or services to its target audience. It includes specific tactics and channels the business will use to reach potential customers. This section defines the company’s unique value proposition, identifies the target market segments, and discusses the competitive landscape. It also includes insight into budget allocation, projected outcomes and key performance indicators to measure success. Marketing plan helps businesses demonstrate their understanding of the market dynamics, their positioning within the industry and their approach to driving customer engagement and sales.

Website: A website that has an order button to inform clients about the items offered by The Hockessin BookShelf.
Content Marketing: Create a blog about new arrival books and books that are on sale at your The Hockessin BookShelf website with material for prospective customers.
Discounts: Provide reward points or incentives to The Hockessin BookShelf customers frequently visit the store.
Social Media: promote The Hockessin BookShelf products and services using Facebook, Instagram, Linkedin, and other social media platforms.
SEO (Search Engine Optimization) helps The Hockessin BookShelf rank higher in searches on Google and other search engines.
Email Marketing: The Hockessin BookShelf will be sending commercial messages to a group of people.
Organogram:

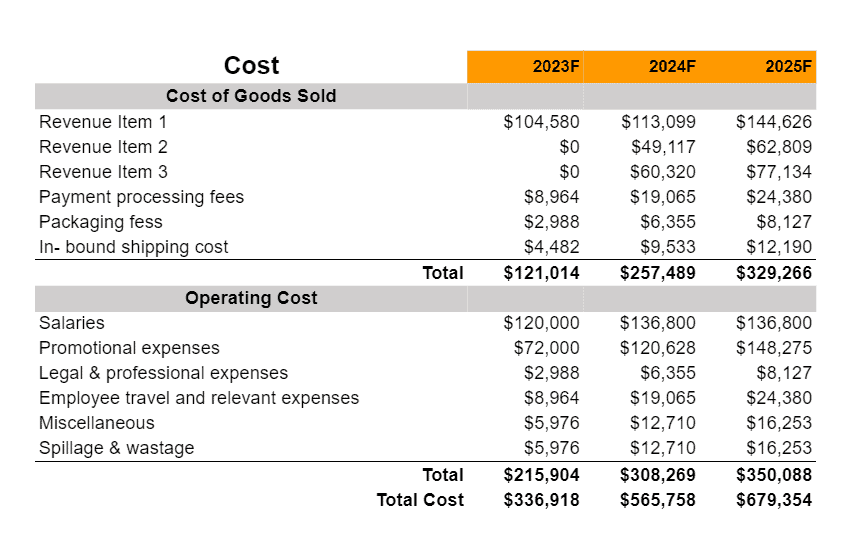
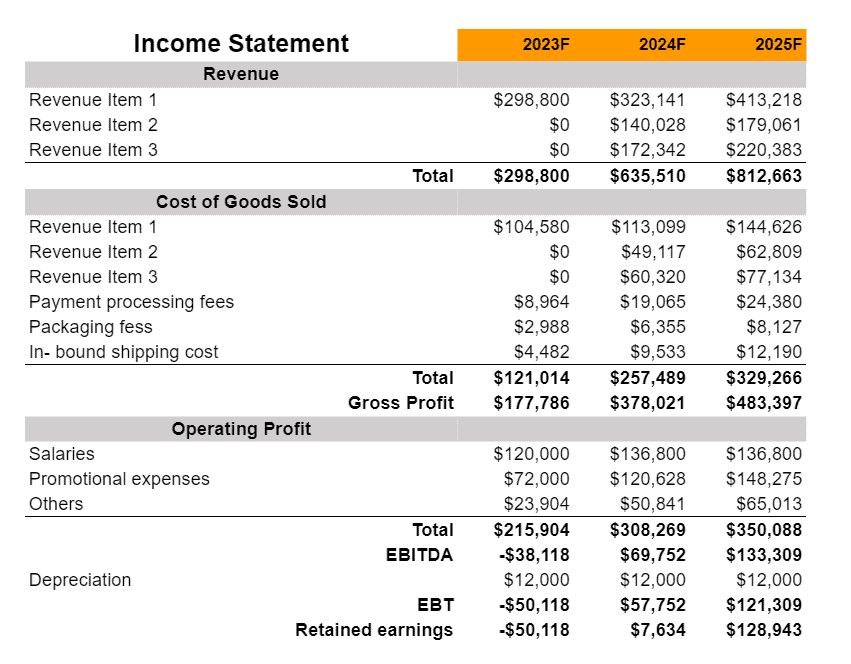
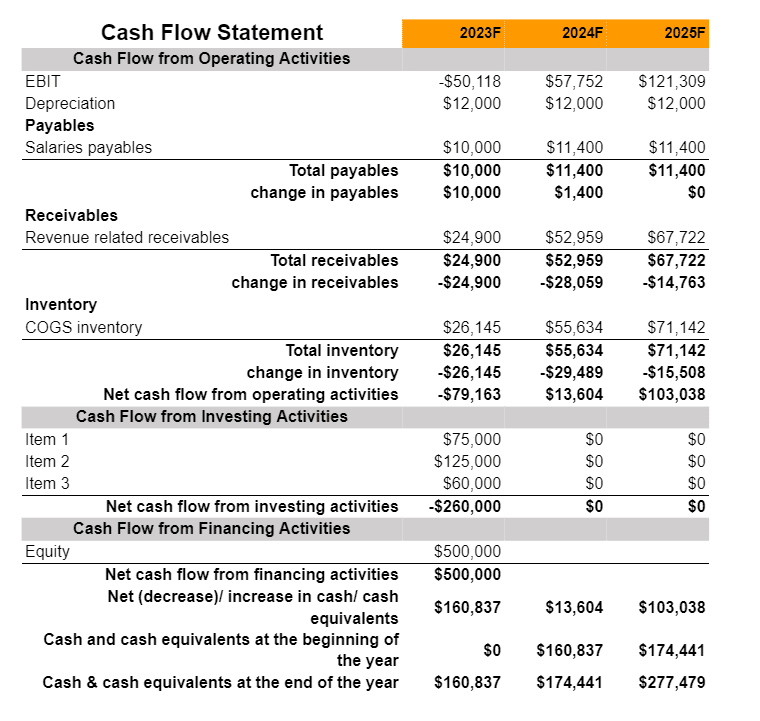
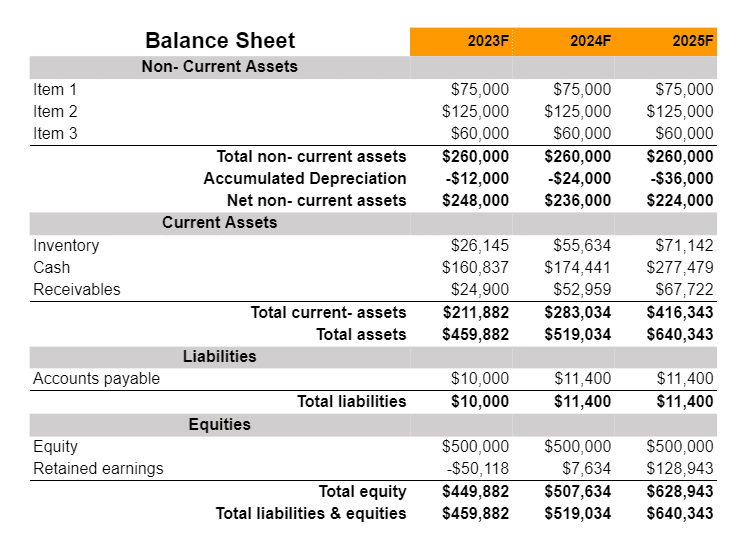
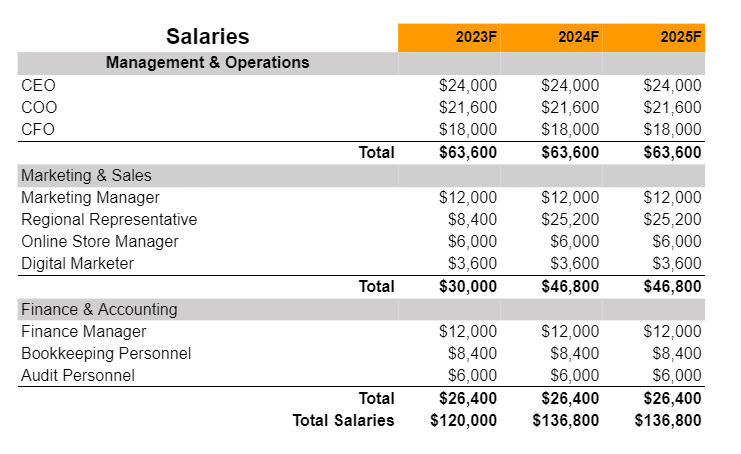
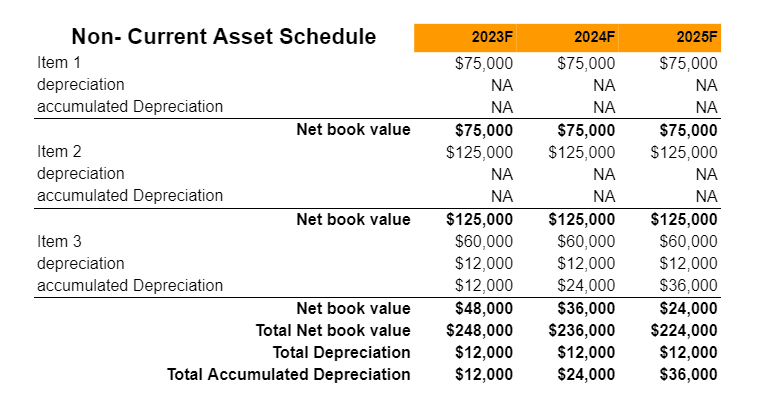
Financial Plan
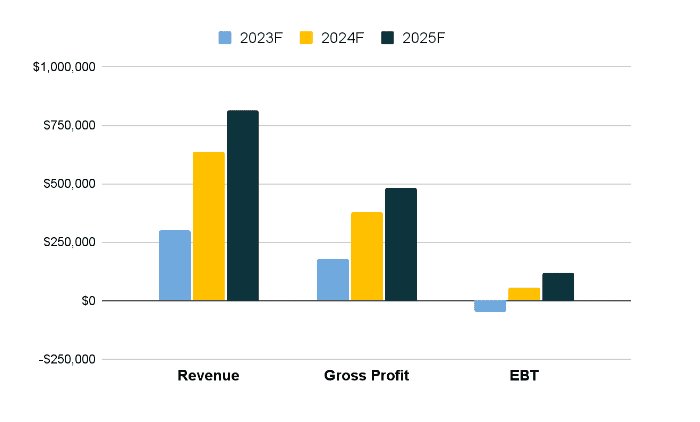
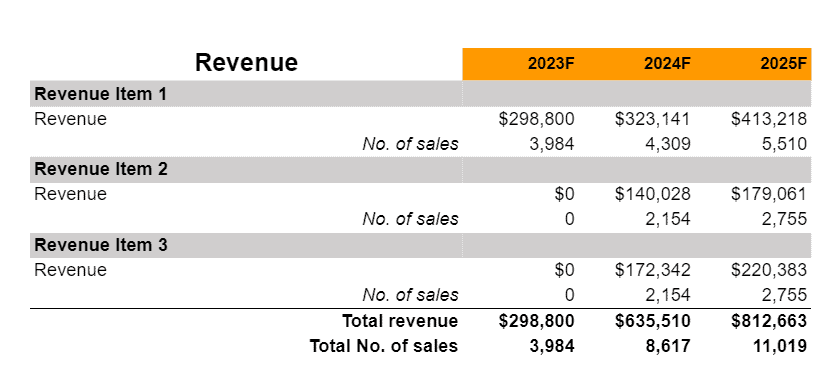
Earnings
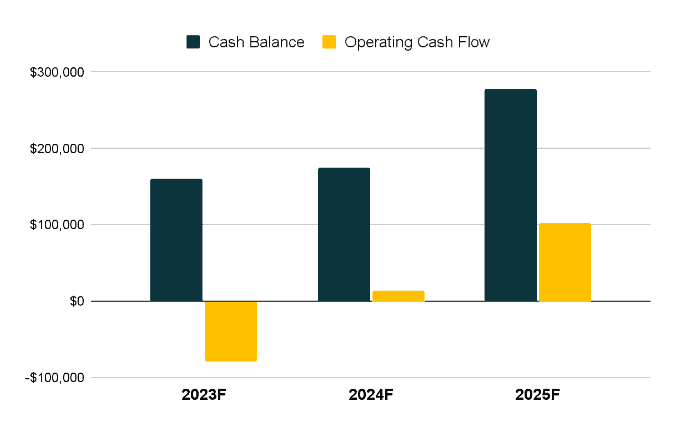
Liquidity
Related Business Plans:

