Written by Elma Steven | Updated on March, 2024
Executive Summary
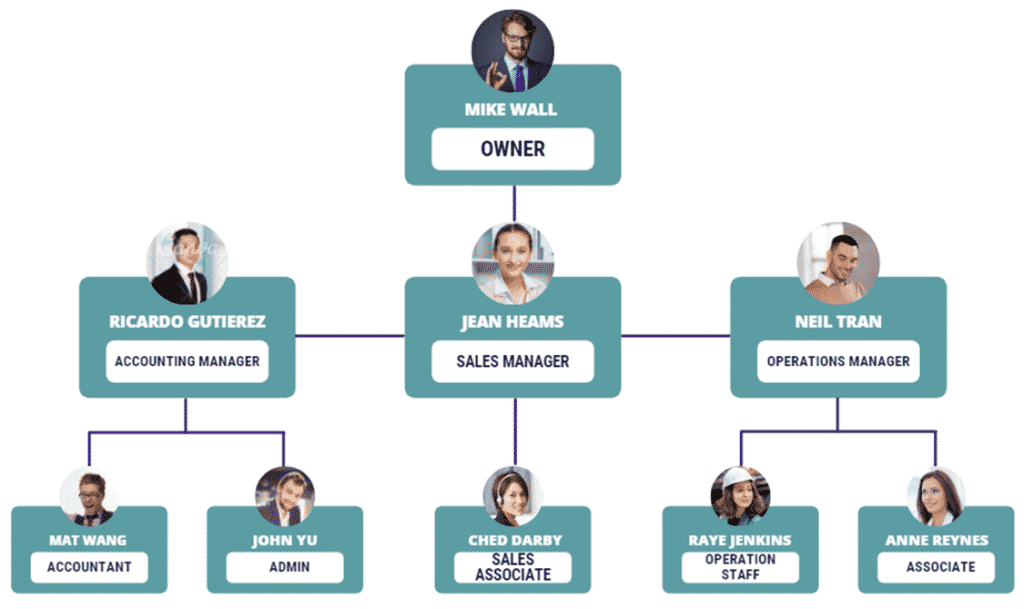
Overview: The gas station will be known as Savoy Gas and will be located on Exit 2 of the New York-Pennsylvania interstate highway in Princeton, New Jersey. Given the huge volume of automobile traffic that passes through the highway on a regular basis, this is a fantastic position. Mike Wall, a petroleum engineer, will own and manage the Savoy gas station. He is a seasoned petroleum engineer with a twenty-five-year record of accomplishment of achievement. Mike has worked in the oil and gas industry for large, recognized worldwide companies. He has been in charge of a number of large-scale industry projects, earning him respect and reputation in the process.
Mike Wall is a petroleum engineer who has worked for a number of well-known oil and gas firms around the country. He’s known for his professionalism and for leading a number of technological projects. Mike has held top positions in a variety of enterprises and has attended numerous local, regional, and international petroleum conferences.
Beginning your own gas station necessitates a thorough understanding of the oil and gas sector. Mike was actively involved in policy development and technical implementation of gas station initiatives over his nearly three decades in the industry. Mike decided that transferring his experience to entrepreneurship would be a terrific idea after working closely with gas station stakeholders.
Mission: To provide dependable, professional, and innovative solutions to all consumers through friendly, great, and convenient services. To show that we are responsible for all we do.
Vision: To be the region’s top distributor and marketer of petroleum products and related services.
Industry Overview

The market is divided into five regions: North America, Europe, Asia Pacific, Latin America, and the Middle East and Africa (MEA). The North American continent is further divided into countries such as the United States and Canada. The European continent is divided into the United Kingdom, France, Germany, Italy, Spain, Russia, and the Rest of Europe. China, Japan, South Korea, India, Australia, Southeast Asia, and the Rest of Asia Pacific make up Asia Pacific. Latin America region is further segmented into Brazil, Mexico, and Rest of Latin America, and the MEA region is further divided into GCC, Turkey, South Africa, and Rest of MEA.
We looked at the Filling Station and Gas Station Market from every angle. Methodologies for primary and secondary research are also used. This aided us in gaining a better grasp of current market dynamics, such as supply-demand imbalances, pricing trends, product preferences, and customer behavior patterns, among other things. Primary research with industry professionals and opinion leaders from around the world confirmed the findings. The data is further compiled & validated through various market estimation & data validation methodologies. Further, we also have our in-house data forecasting model to predict market growth up to 2028.
Financial Overview
Financial Highlights
| Liquidity | 2020A | 2021A | 2022F | 2023F | 2024F |
| Current ratio | 6 | 12 | 23 | 32 | 42 |
| Quick ratio | 6 | 11 | 22 | 31 | 40 |
| DSO | 8 | 8 | 8 | 8 | 8 |
| Solvency | |||||
| Interest coverage ratio | 8.2 | 11.1 | 14.2 | ||
| Debt to asset ratio | 0.01 | 0.01 | 0.2 | 0.18 | 0.16 |
| Profitability | |||||
| Gross profit margin | 51% | 51% | 53% | 53% | 53% |
| EBITDA margin | 12% | 14% | 21% | 22% | 22% |
| Return on asset | 5% | 6% | 13% | 14% | 14% |
| Return on equity | 5% | 6% | 16% | 17% | 17% |
Use of Funds
Industry Analysis
With strategic analysis, micro and macro market trend and scenarios, price analysis, and a holistic picture of the market conditions in the forecast period, the Filling Station and Gas Station Market research study keeps a close eye on top rivals. A thorough research focuses on key and secondary drivers, market share, leading segments, and geographic analysis. The research also examines significant players, major collaborations, mergers and acquisitions, as well as current innovation and corporate policies.
A gas station, also known as a petrol station, filling station, fueling station, or service station, is a commercial establishment that sells gasoline (petrol), diesel, and lubricants for automobiles. Customers can choose from three categories of service at gas stations: full service, minimum service, or self-service.
A full service gas station employs attendants who operate the pumps, wipe the windshield, and occasionally check the vehicle’s oil level and tire pressure before collecting payment and possibly a small tip. A minimum service gas station employs attendants who operate the pumps. Because some towns have rules prohibiting customers from manipulating the pumps themselves, this is frequently required.
This industry primarily sells gasoline for automobiles, although it may also include car washes, repairs, and inspections. Any significant corporations do not dominate the industry. Despite the fact that large oil firms hold only a few retail-fueling stations, many gas stations have agreements to sell specific brands of gasoline.
The volume of consumer and commercial driving determines demand. Individual companies’ profitability determined by their ability to secure high-traffic locations, create high-volume sales, and purchase gas at the lowest possible price. Large corporations have purchasing and financial advantages. Small businesses can compete effectively if they have better locations. The industry in the United States is highly concentrated: the top 50 companies account for around 55% of total sales.
Marketing Plan
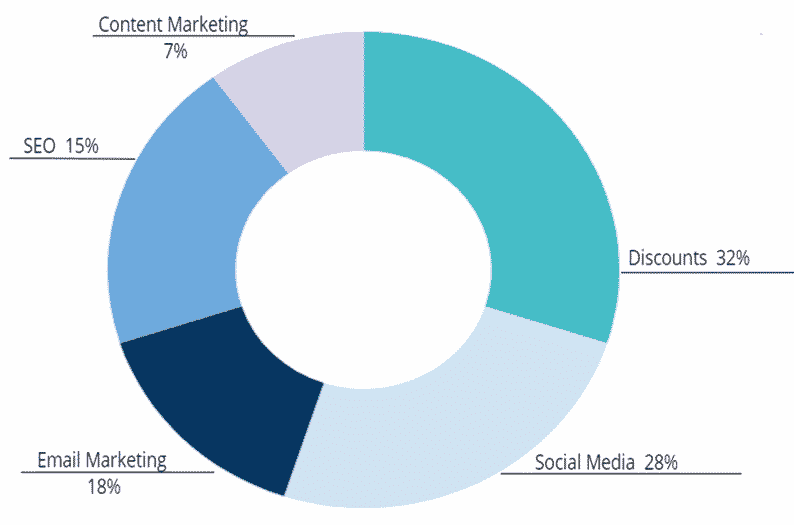
Discounts: Mike Wall will give discounts to customers to show our appreciation for your contribution to our success.
Social Media: Following the trend of clients surfing the Internet every second, online advertising has become a commonplace tool utilized by all businesses. Facebook, Instagram, and other social media platforms will be used to promote Savoy Gas.
Email Marketing: We use email as a tool for sending commercial communications and generating sales. To develop long-term connections and promote long-term revenue, we will send cart abandonment emails or execute repeated email nurturing campaigns.
SEO: To increase awareness to the customers we will use search engine optimization for boosting our company to attract more customer by searching gas.
Content Marketing: We will share relevant articles, videos and blogs to retain audiences and to know more about our products.
Organizational Plan
Financial Plan
Earnings:
Income Statement:
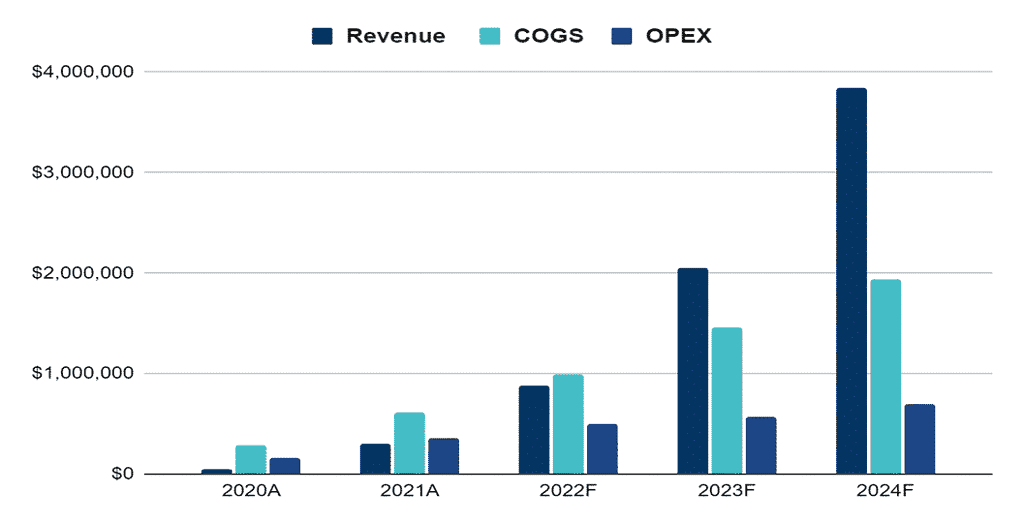
| 2020A | 2021A | 2022F | 2023F | 2024F | |
| ANNUAL REVENUE | |||||
| Item 1 | 9,217 | 59,117 | 175,410 | 415,277 | 781,357 |
| Item 2 | 34,701 | 222,558 | 660,368 | 1,563,394 | 2,941,580 |
| Item 3 | 4,067 | 19,561 | 46,432 | 78,519 | 114,905 |
| Total annual revenue | 47,985 | 301,236 | 882,211 | 2,057,189 | 3,837,842 |
| % increase | 528% | 193% | 133% | 87% | |
| COST of REVENUE | |||||
| Item 1 | 360 | 2,259 | 6,617 | 15,429 | 28,784 |
| Item 2 | 480 | 3,012 | 8,822 | 20,572 | 38,378 |
| Item 3 | 52,000 | 65,000 | 78,000 | 91,000 | 104,000 |
| Item 4 | 720 | 3,615 | 8,822 | 16,458 | 23,027 |
| Item 5 | 140,000 | 336,000 | 560,000 | 840,000 | 1,120,000 |
| Item 6 | 60,000 | 144,000 | 240,000 | 360,000 | 480,000 |
| Item 7 | 32,000 | 61,333 | 85,533 | 112,153 | 141,435 |
| Total Cost of Revenue | 285,560 | 615,220 | 987,794 | 1,455,612 | 1,935,625 |
| as % of revenue | 595% | 204% | 112% | 71% | 50% |
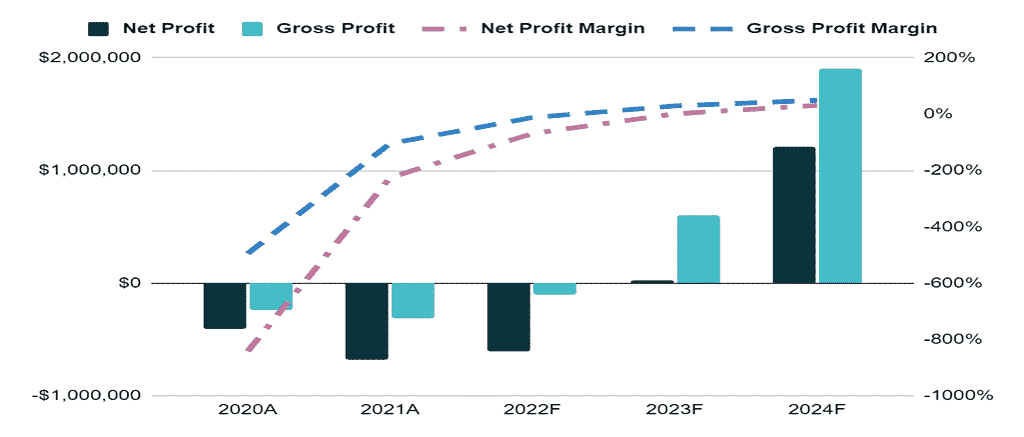
| Gross Profit | -237,575 | -313,984 | -105,583 | 601,578 | 1,902,218 |
| SELLING & ADMIN EXPENSES | |||||
| Item 1 | 28,000 | 96,800 | 154,880 | 175,692 | 193,261 |
| Item 2 | 75,000 | 105,000 | 120,000 | 120,000 | 120,000 |
| Item 3 | 36,000 | 96,000 | 108,000 | 120,000 | 120,000 |
| Item 4 | 8,000 | 12,000 | 12,000 | 12,000 | 12,000 |
| Item 5 | 3,839 | 18,074 | 44,111 | 61,716 | 115,135 |
| Item 6 | 3,359 | 12,049 | 26,466 | 41,144 | 76,757 |
| Item 7 | 5,600 | 10,000 | 12,904 | 15,034 | 17,376 |
| Item 8 | 6,667 | 14,000 | 22,067 | 30,940 | 40,701 |
| Total selling & admin expenses | 166,464 | 363,924 | 500,428 | 576,525 | 695,230 |
| as % of revenue | 347% | 121% | 57% | 28% | 18% |
| Net profit | -404,039 | -677,907 | -606,011 | 25,052 | 1,206,987 |
| Accumulated net profit | -404,039 | -1,081,947 | -1,687,957 | -1,662,905 | -455,918 |
