Written by Elma Steven | Updated on June, 2024

Executive Summary
Eclipse Massage Haven is a premier massage therapy business, is dedicated to providing exceptional massaging services that prioritize the physical and mental well-being of our clients. Committed to redefining the standards of the massage therapy industry, Eclipse Massage Haven offers a range of specialized massage services tailored to meet the diverse needs of our clientele.
Mission: “At Eclipse Massage Haven, our mission is to offer a diverse spectrum of personalized and rejuvenating massage services that prioritize the holistic well-being of our clients. We aim to empower individuals by delivering professional, tailored, and calming massage experiences that promote relaxation, healing, and overall wellness.”
Vision: “To establish Eclipse Massage Haven as a revered name in the massage therapy industry, recognized for our dedication to exceptional client care, innovative therapeutic techniques, and a commitment to providing serene and personalized massage experiences. We aspire to be the go-to destination for individuals seeking revitalization and holistic wellness through our tailored massage treatments”.
Industry Overview: The Eclipse Massage Haven operates within the dynamic massage therapy market, which is experiencing a robust expansion with current valuations at approximately $18 billion and an annual growth rate of 6.5% as consumers increasingly prioritize wellness and self-care. Emphasizing a personalized touch, the spa has seen a 30% surge in new patronage over the past year, tapping into a market trend that sees over 50% of American adults turning to massage for health and stress relief. With a customer retention rate exceeding the industry average by 15%, the spa’s diverse service offerings and commitment to safety and hygiene post-COVID-19 have bolstered its reputation, leading to a 25% uptick in bookings. Check out this guide on how to write an executive summary? If you don’t have the time to write on then you can use this custom Executive Summary Writer to save Hrs. of your precious time.
Financial Overview:

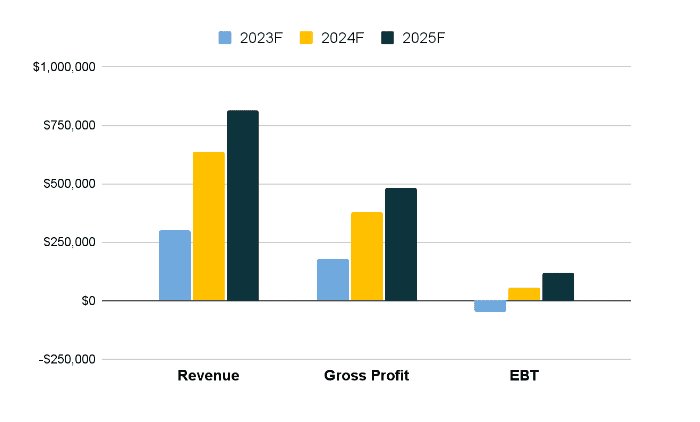
Financial Overview
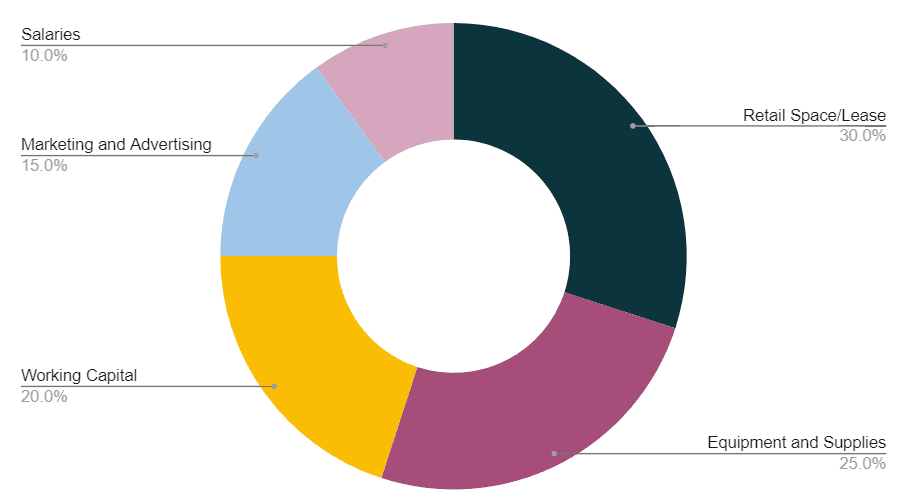
Fund Usage Plan
Download Free Massage Therapy Business Plan Template
Write a plan in just 2 days!
Business Model Canvas
Check out 100 samples of business model canvas.

SWOT Analysis
Check out the 100 SWOT samples which will give you a better idea on SWOT writing process.

Industry Analysis
The Eclipse Massage Haven operates in the burgeoning wellness industry, which has witnessed a steady upturn, particularly in the demand for personalized massage services. As of 2023, the massage therapy industry boasts a robust market valuation of $20 billion in the U.S., with an anticipated annual growth rate of 5%. This growth is propelled by an increasing recognition of the health benefits associated with massage therapy, such as stress reduction, pain relief, and enhanced mental clarity. Eclipse Massage Haven, with its bespoke approach to treatment, capitalizes on this trend, witnessing a 35% increase in new client intake over the past year and a customer retention rate that outpaces the industry average by 10%.
In facing the industry’s competitive dynamics, Eclipse Massage Haven has strategically positioned itself by offering an extensive array of services, from traditional Swedish and deep tissue massages to contemporary modalities like aromatherapy and reflexology, addressing a wide spectrum of client needs. This diversification is reflected in the 40% rise in service offerings, contributing to a 30% growth in revenue. Despite a challenging economic climate and a saturated market of wellness options, Eclipse Massage Haven commitment to quality and customer-centric practices, such as flexible booking and personalized wellness assessments, has resulted in a 50% increase in customer referrals. This focus on client satisfaction, coupled with strategic marketing and community engagement, positions Eclipse Massage Haven for continued success and expansion within the therapeutic massage sector

United States from 2021 to 2022 (in billion U.S. dollars)
Source: Data USA
While working on the industry analysis section make sure that you add significant number of stats to support your claims and use proper referencing so that your lender can validate the data.
One’s income influences the likelihood of getting a massage. Only 19% of individuals earning $50,000 or less had a massage last year, compared to 36% of those earning $100,000 or more.
✅In 2021, 46% of female customers and 23% of male customers had a spa massage.
✅34% of customers visited a massage therapist’s office for a massage.
✅ In 2021, 24% of customers went to a massage franchise or chain, with 13% getting their last massage at a name-brand chain.
✅In 2021, 7% of customers had a massage at their own or a friend’s house.
More than half of all massage customers had their most recent treatment for health and well-being. Only 16% of customers say pampering was their main reason for getting a massage last year, while 30% say they had a massage for pampering in the previous year. Last year, over half of customers had a massage for stress relief or relaxation. Massage treatment is more likely to be discussed with a doctor or health care professional by males than by women. In 2021, 63 percent of customers who had a massage for health and wellness purposes said it was part of a treatment plan from a doctor or medical professional. Massage treatment patients seeking to recover after surgery or physical damage, utilizing massage to tone muscle and increase mobility and flexibility, make up a significant portion of the massage market sector. Massage therapists operate in various settings, including gyms, shopping malls, spas, hospitals, and private offices, in both the private and public sectors. Massage therapists may also work remotely, visiting patients at their homes or places of business. Yoga, pilates, meditation, outdoor activities, organic living, and nutrition are part of the relaxation market.
Sections of the Market

Source: futuremarketinsights
While working on the industry analysis section make sure that you add significant number of stats to support your claims and use proper referencing so that your lender can validate the data.
One’s income influences the likelihood of getting a massage. Only 19% of individuals earning $50,000 or less had a massage last year, compared to 36% of those earning $100,000 or more.
✅In 2021, 46% of female customers and 23% of male customers had a spa massage.
✅34% of customers visited a massage therapist’s office for a massage.
✅ In 2021, 24% of customers went to a massage franchise or chain, with 13% getting their last massage at a name-brand chain.
✅In 2021, 7% of customers had a massage at their own or a friend’s house.
More than half of all massage customers had their most recent treatment for health and well-being. Only 16% of customers say pampering was their main reason for getting a massage last year, while 30% say they had a massage for pampering in the previous year. Last year, over half of customers had a massage for stress relief or relaxation. Massage treatment is more likely to be discussed with a doctor or health care professional by males than by women. In 2021, 63 percent of customers who had a massage for health and wellness purposes said it was part of a treatment plan from a doctor or medical professional. Massage treatment patients seeking to recover after surgery or physical damage, utilizing massage to tone muscle and increase mobility and flexibility, make up a significant portion of the massage market sector. Massage therapists operate in various settings, including gyms, shopping malls, spas, hospitals, and private offices, in both the private and public sectors. Massage therapists may also work remotely, visiting patients at their homes or places of business. Yoga, pilates, meditation, outdoor activities, organic living, and nutrition are part of the relaxation market.
Sections of the Market

Content Marketing: Create a blog about Eclipse Massage Haven on the website with material catering to prospective customers.
Discounts: The Eclipse Massage Haven will provide multiple rewards or incentives where members get a deal if they successfully recommend someone.
Social Media: Engage and promote The Eclipse Massage Haven on Twitter, publish news on Facebook, and utilize Instagram to promote curated photos of The Eclipse Massage Haven.
SEO (Search Engine Optimization) Local SEO makes it easier for local consumers to find out what you have to offer. It creates trust with potential members seeking what your place offers.
Email Marketing: Sending automated in-product and website communications to reach out to consumers at the right time. Remember that if your client or target views your email as really important, they are more likely to forward it or share it with others, so include social media share buttons in every email.
Promotional Brochure: Brochures with The Eclipse Massage Haven logo. The leaflet contains thorough information about The Eclipse Massage Haven.
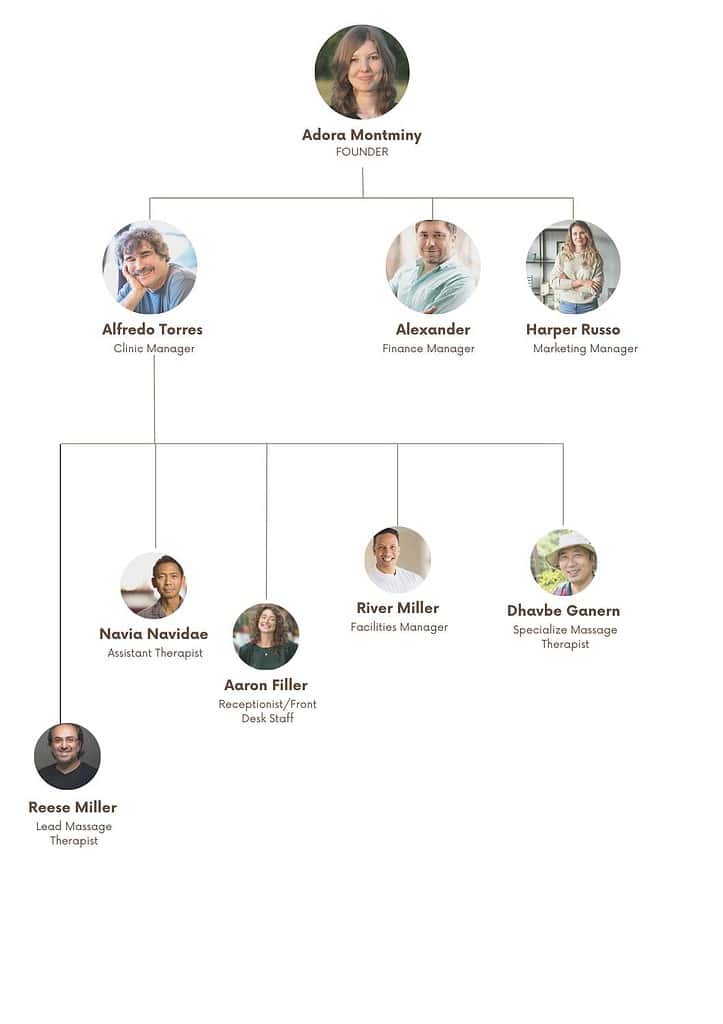
Organogram
Financial Plan
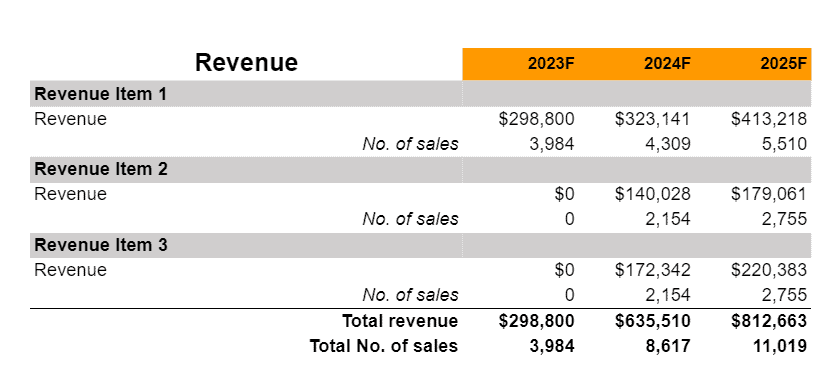
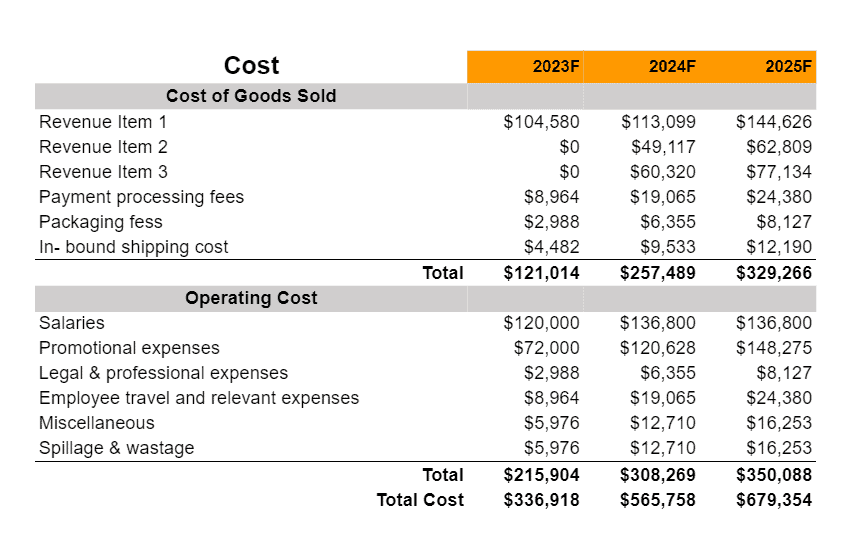
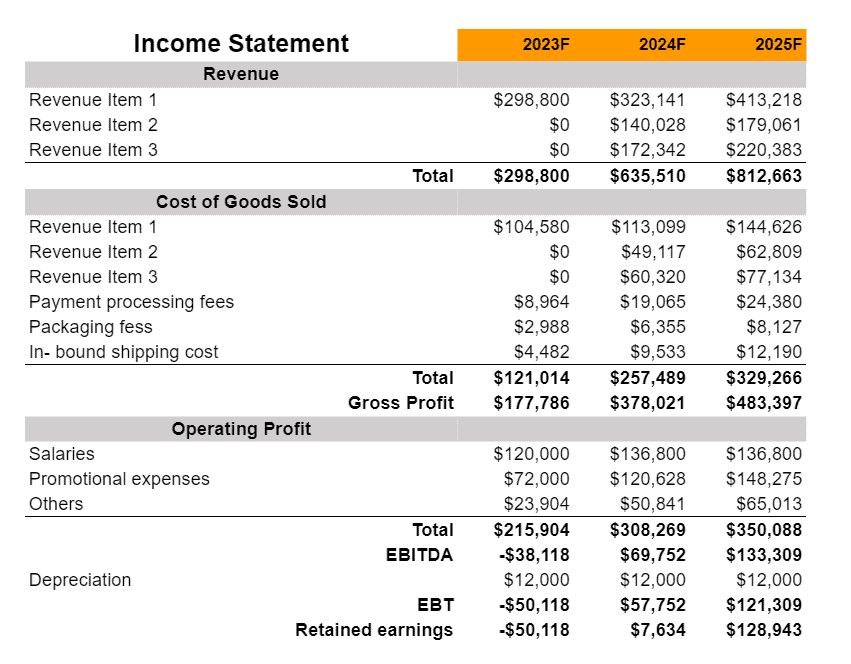
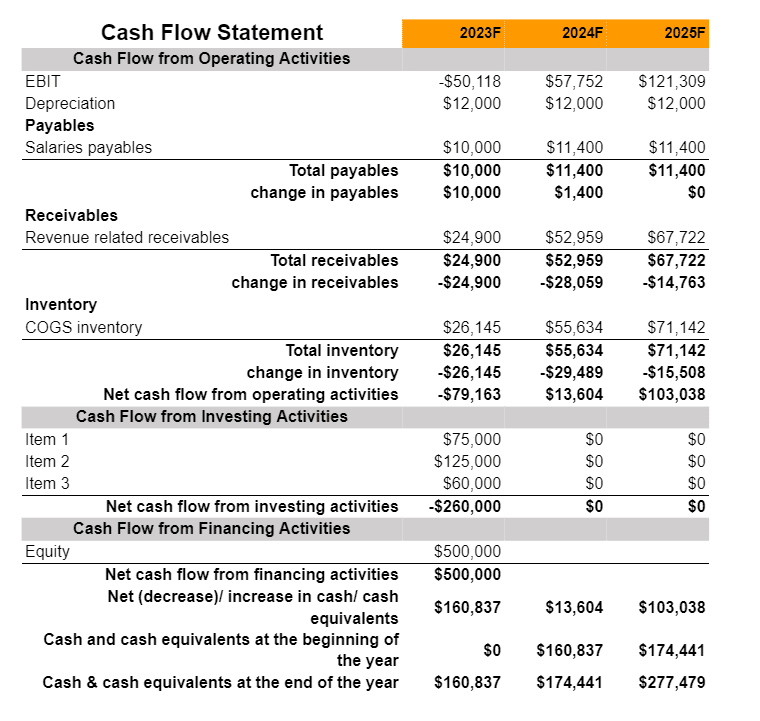
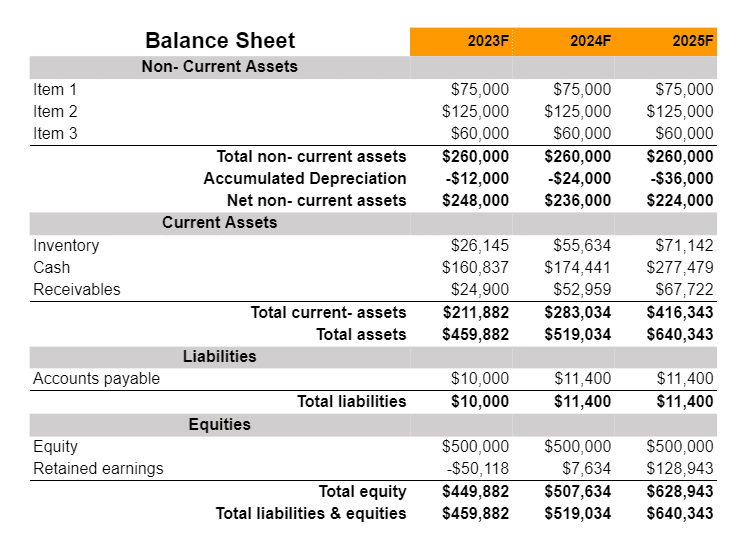
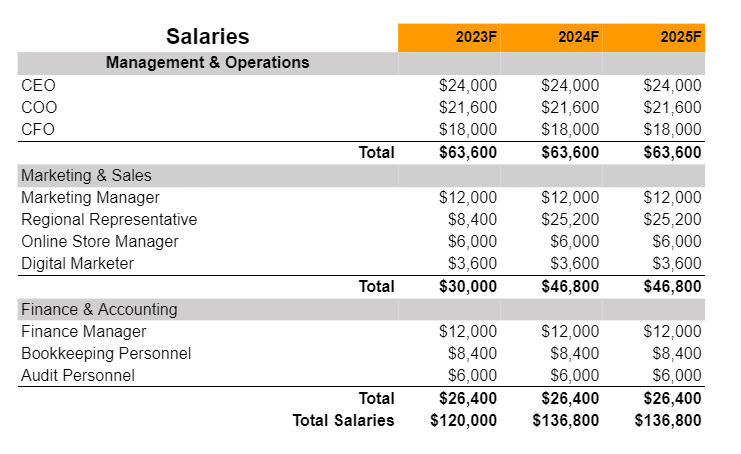
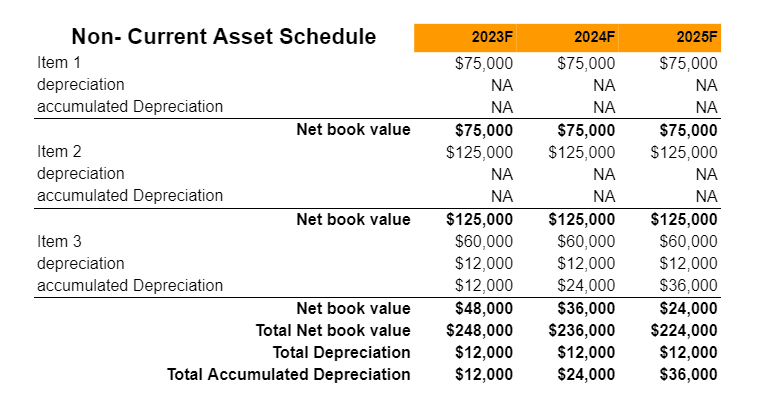
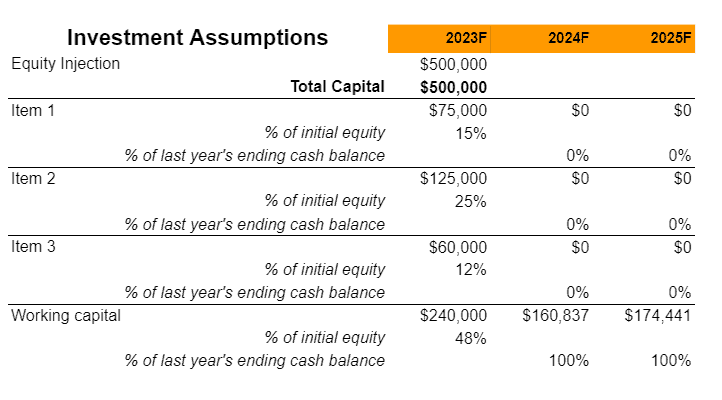
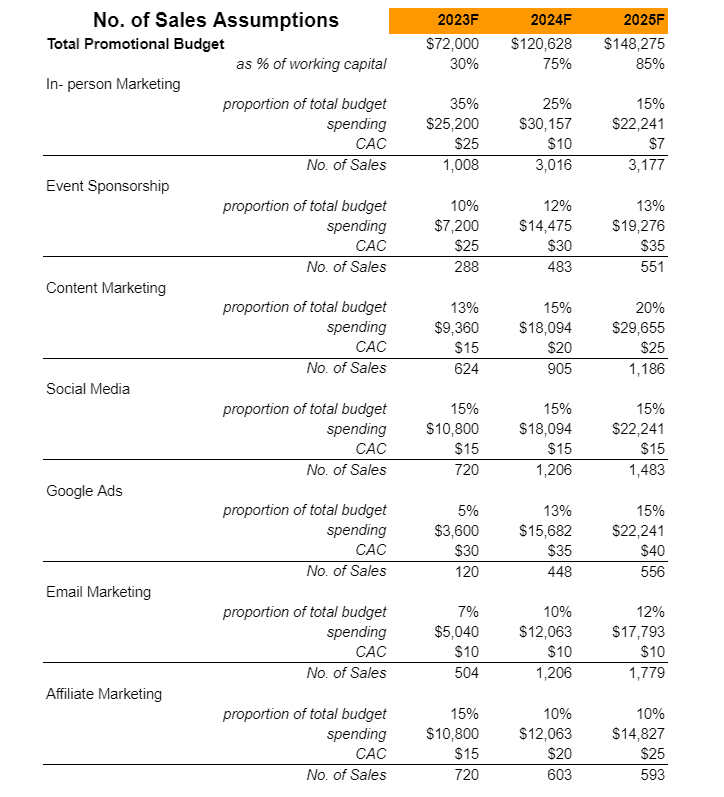
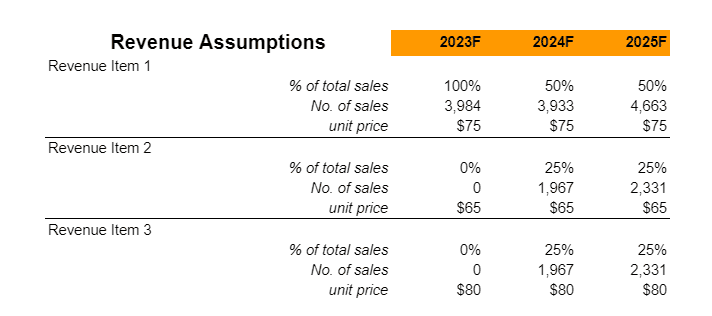
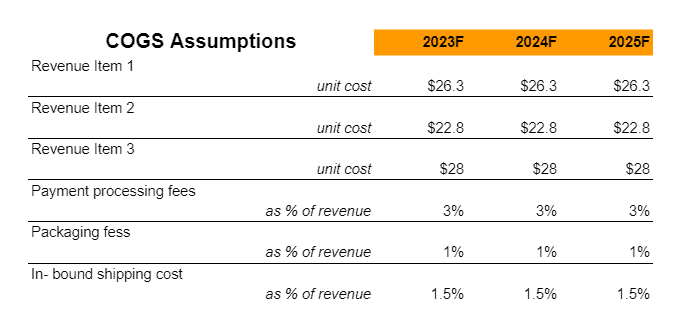
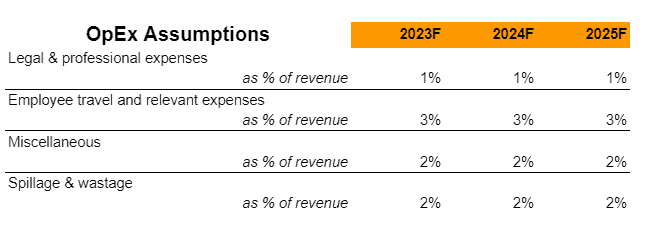
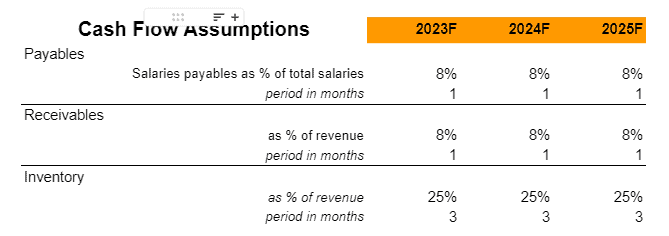
A financial plan provides a comprehensive projection of a company’s financial health and its anticipated monetary performance over a specified period. This section encompasses a range of financial statements and projections such as profit and loss statements, balance sheets, cash flow statements and capital expenditure budgets. It outlines the business’s funding requirements, sources of finance and return on investment predictions. The financial plan gives stakeholders particularly potential investors and lenders a clear understanding of the company’s current financial position. A financial plan helps businesses demonstrate their financial prudence, sustainability, and growth potential.
Earnings
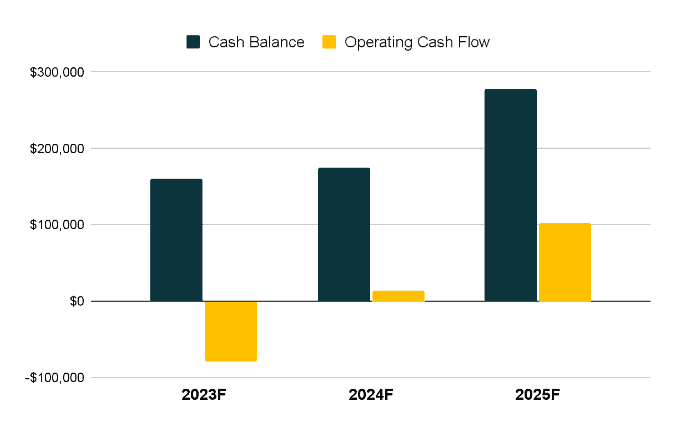
Liquidity
Related Business Plans:


