Written by Elma Steven | Updated on June, 2024

How to Write a Tattoo Studio Business Plan?
Tattoo Studio Business Plan is an outline of your overall Tattoo Studio business. The business plan includes a 5 year projection, marketing plan, industry analysis, organizational overview, operational overview and finally the executive summary. Remember to write your executive summary at the end as it is considered as a snapshot of the overall business plan. The creation of a plan requires careful consideration of various factors that might impact the business’s success.
Table of Contents
Executive Summary
Overview: East Coast Worldwide Tattoo and Piercing Studio, We are the top-rated studio in the North Florida region. We believe in complete openness with all of our customers. Each consumer deserves the highest level of protection and happiness. We provide a relaxing environment with a competent body art team dedicated to delivering high-quality art and comfort. We can also confidently state that no studio in Florida is cleaner.
Mission: it is our objective to offer you high-quality, personalized tattoos and piercings created by our brilliant artists and excellent customer service
Vision: To become the world’s most respected, successful, and well-known tattoo and piercing studio, not just by deed but also through friendship, understanding, and integrity.
Industry Overview: The tattoo industry has witnessed a dynamic evolution, particularly in recent years. As of 2023, it’s valued at approximately $3 billion in the United States alone, with a steady growth trajectory influenced by increasing societal acceptance and a broader demographic appeal. The industry is marked by a rising demand for customized and unique tattoo designs, driven by a younger, diverse clientele seeking self-expression through body art. Additionally, technological advancements in tattoo equipment and inks have enhanced both the safety and quality of tattoos, contributing to the sector’s expanding popularity and professionalization.
Check out this guide on how to write an executive summary? If you don’t have the time to write on then you can use this custom Executive Summary Writer to save Hrs. of your precious time.
Financial Overview:

Get the Free Business Plan Template
Get the template over email
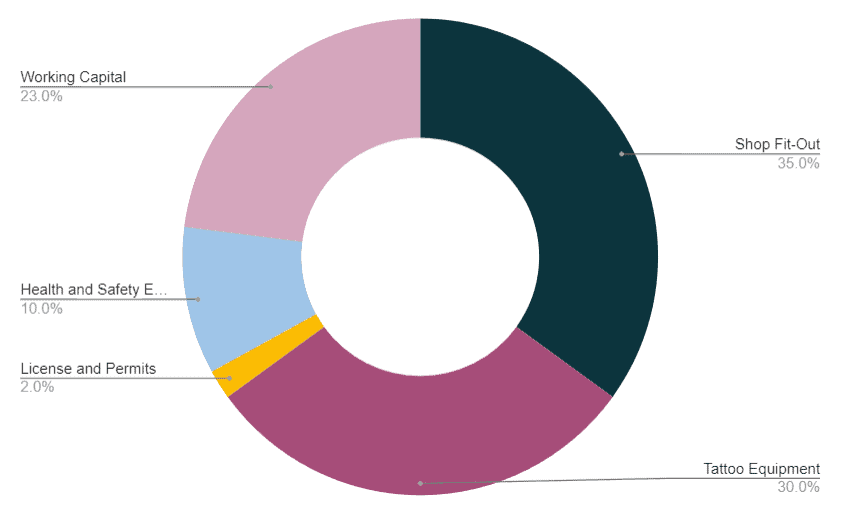
Fund Usage
Business Model Canvas
Check out the 100 samples of business model canvas.

SWOT
Check out the 100 SWOT Samples

Industry Analysis
The tattoo industry, a vibrant and ever-evolving sector, has become a significant part of the global beauty and personal expression market. As of 2023, the industry in the United States is estimated to be worth around $3 billion, reflecting a consistent growth trend. This expansion can be attributed to various factors, including increased social acceptance of tattoos, a rise in the number of skilled tattoo artists, and an expanding demographic of consumers across all age groups.
Technological advancements have played a crucial role in this growth. Innovations in tattooing equipment and inks have made the process safer and more efficient, thereby attracting a broader client base. These advancements have also allowed for more intricate and diverse designs, catering to the growing demand for personalized and unique tattoos. Furthermore, the rise of social media platforms has provided artists with a powerful tool to showcase their work, reaching wider audiences and fostering a global community of tattoo enthusiasts.
The industry is not without its challenges, however. Stringent regulations, varying by region, impact the operation of tattoo studios, particularly concerning health and safety standards. Additionally, the market faces competition from temporary tattoo alternatives and digital simulation technologies. However, the industry’s resilience is evident in its ability to adapt and innovate, meeting the changing tastes and preferences of consumers. The future of the tattoo industry appears promising, with forecasts suggesting continued growth, driven by an ongoing fascination with body art as a form of personal and artistic expression.

Source: marineagency
While working on the industry analysis section make sure that you add significant number of stats to support your claims and use proper referencing so that your lender can validate the data.
According to market research, the tattoo business will earn an expected $1.7 billion in sales in 2020, up from $1.6 billion in 2019. U.S. Tattoo Parlors, Tattoo Removal, and Body Piercing Services: Research Director and Author, an Industry Analysis weigh-in. “Tattoos and body art have recently gained popularity in the United States, particularly among Millennials, supporting an industry of 20,000 tattoo parlors or studios.” The $3 billion markets, including body piercing and tattoo removal, are rapidly expanding.”
The industry is predicted to increase at almost 8% each year over the next ten years. Its cultural significance may be attributed to its success. This nearly 8% rise is due to the growing popularity of tattoos and younger generations opting for more costly bespoke work over less expensive predesigned (or flash) graphics. Customer return rates skyrocket once they’ve been tattooed. While the overall number of tattoo customers grew, earnings per tattoo grew, with millennials between the ages of 18 to 35 leading the way.
According to the Harris Poll, a small company industry research organization, about 47% of millennials have at least one tattoo, 37% have two, and 15% have five or more. Tattoo removal has become more common as the tattoo business has grown in prominence. According to American Academy for Dermatologic Surgery, 687,450 tattoos have been erased since 2010. today’s tattoos, the operation is not only time-consuming but also costly.
The global tattoo market has been developing quicker with considerable growth rates in recent years, and it is expected to rise considerably in the anticipated period, 2019 to 2026.
For the projected period (2017–2026), the Global Tattoo Industry study offers a comprehensive market analysis. The research is divided into sections and includes an analysis of the market’s trends and dynamics. These elements, referred to as market dynamics, have the drivers, constraints, opportunities, and challenges and the market’s effect on these aspects. Market intrinsic variables are drivers and restrictions, while extrinsic market aspects are opportunities and challenges. The Global Tattoo Market report forecasts revenue growth throughout the forecast period.
In 2022, the Tattoo Artists sector will have a market size of 1.4 billion dollars in sales. In 2022, the Tattoo Artists market is estimated to grow by 5.4%. Between 2017 and 2022, the Tattoo Artists market in the United States grew at an annual rate of 8.4 percent. The Tattoo Artists industry grew at a greater rate than the real economy in the United States. The Tattoo Artists industry grew faster than the Consumer Goods and Services sector in the United States. The number of people aged 20 to 64 is the most significant negative element impacting this business. At the same time, an increasing life cycle stage is the most important positive aspect. Tattoo demand is driven mainly by adults between the ages of 20 and 64. This group is the most likely to have a tattoo, mainly before 50. The number of persons aged 20 to 64 is predicted to rise in 2021, providing the business with a potential opportunity.
Marketing Plan
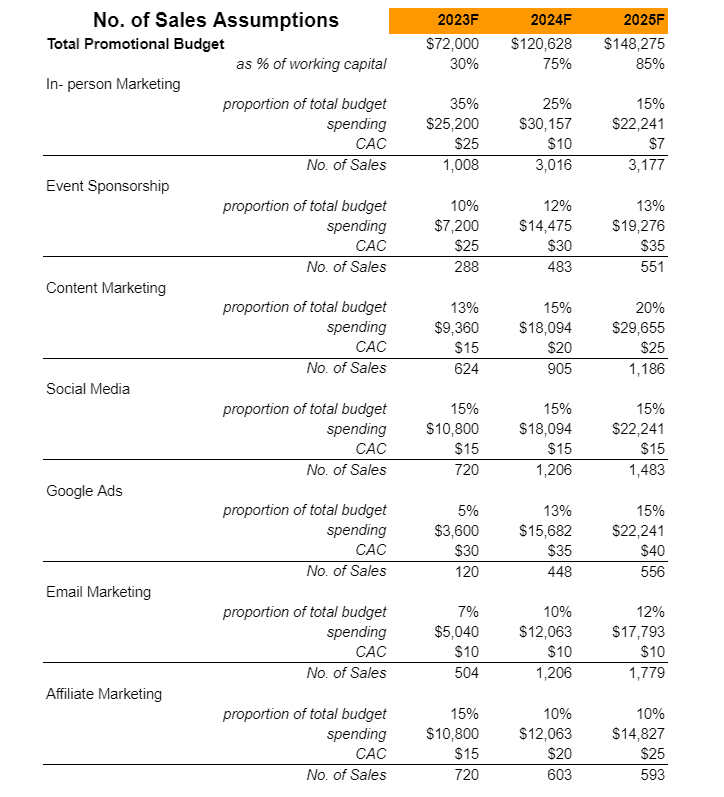
A marketing plan outlines the company’s strategy to promote its products or services to its target audience. It includes specific tactics and channels the business will use to reach potential customers. This section defines the company’s unique value proposition, identifies the target market segments, and discusses the competitive landscape. It also includes insight into budget allocation, projected outcomes and key performance indicators to measure success. Marketing plan helps businesses demonstrate their understanding of the market dynamics, their positioning within the industry and their approach to driving customer engagement and sales.

Content Marketing: Create a blog on the website with material catering to prospective customers of East Coast Worldwide Tattoo and Piercing Studio.
Discounts: Provide multiple rewards or incentives where members of East Coast Worldwide Tattoo and Piercing Studio get a deal if they successfully recommend someone.
Social Media: Engage and promote on Twitter, publish news on Facebook, and utilize Instagram to promote curated photos of your space and events. Think about if you have a place in your budget for Facebook Marketing or other social media-focused ads.
SEO (Search Engine Optimization) Local SEO makes it easier for local consumers to find out what you have to offer. It creates trust with potential members seeking what your place offers.
Email Marketing: Sending automated in-product and website communications to reach out to consumers at the right time. Remember that if your client or target views your email as really important, they are more likely to forward it or share it with others, so include social media share buttons in every email.
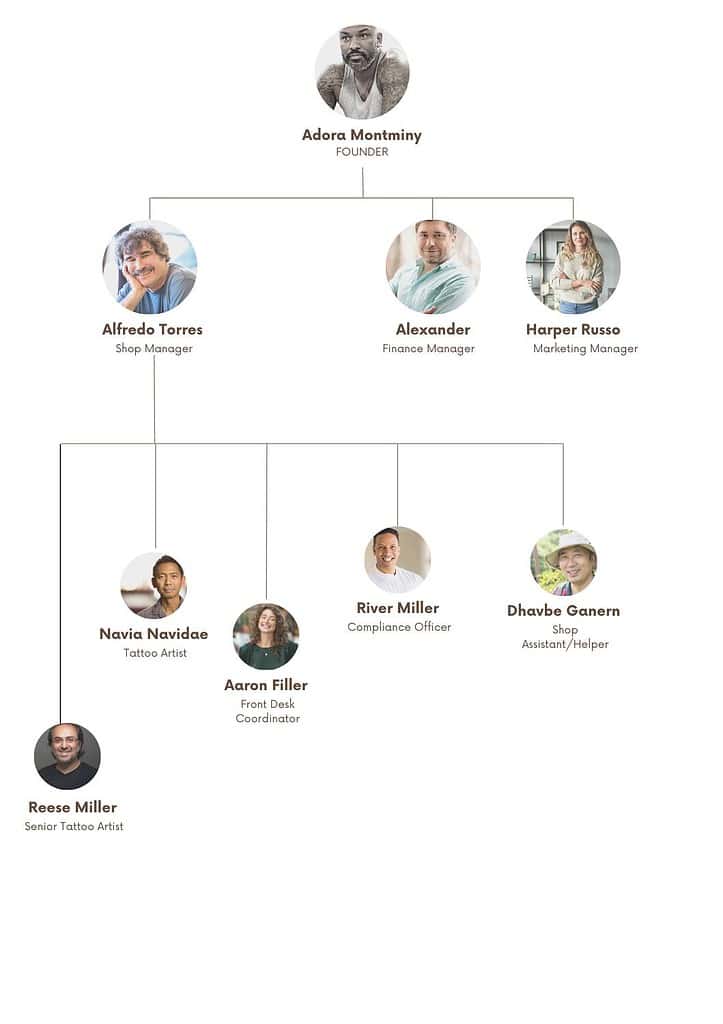
Organogram
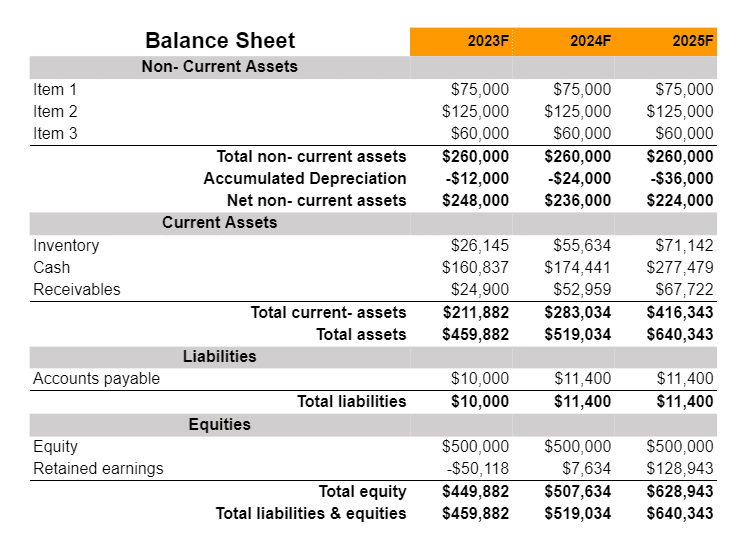
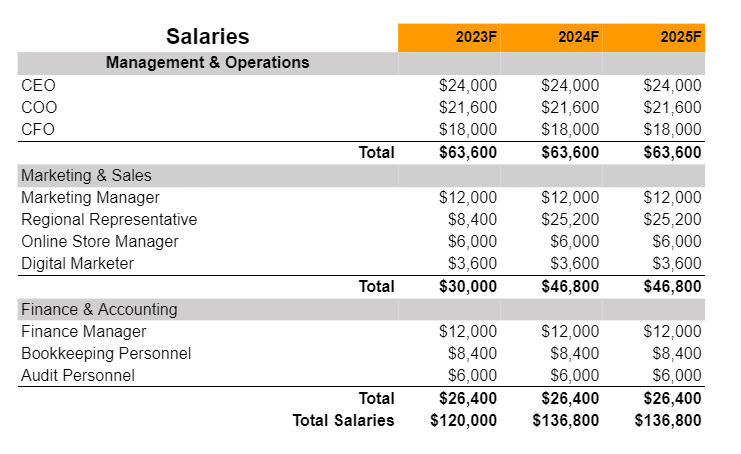
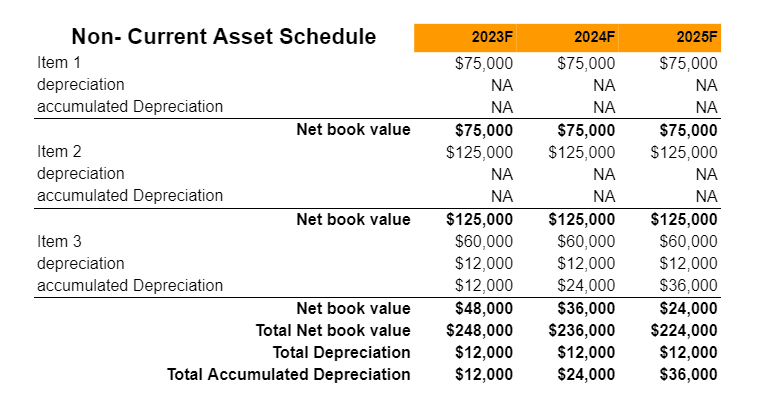
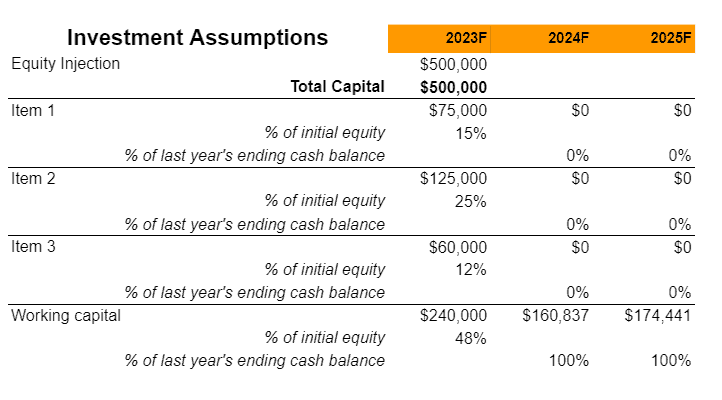
Financial Plan
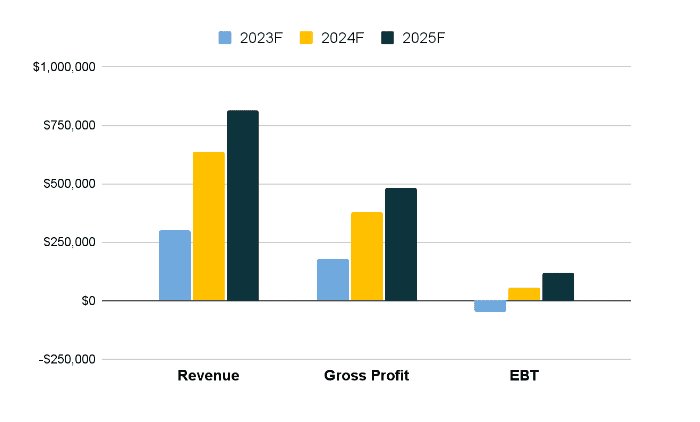
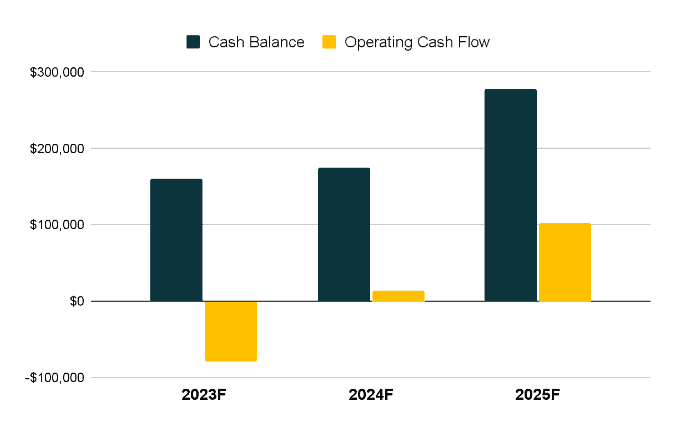
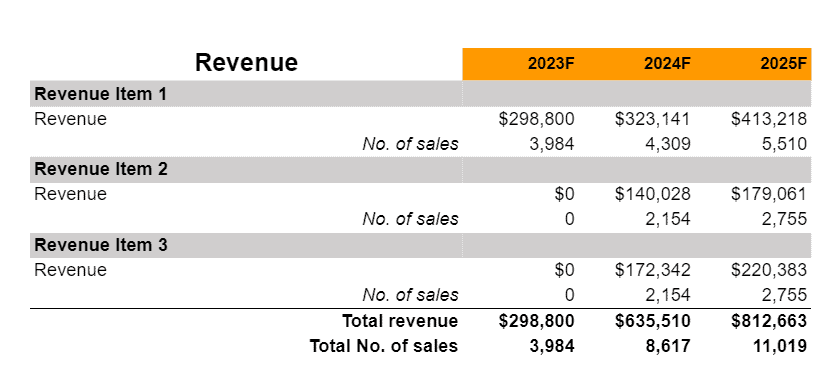
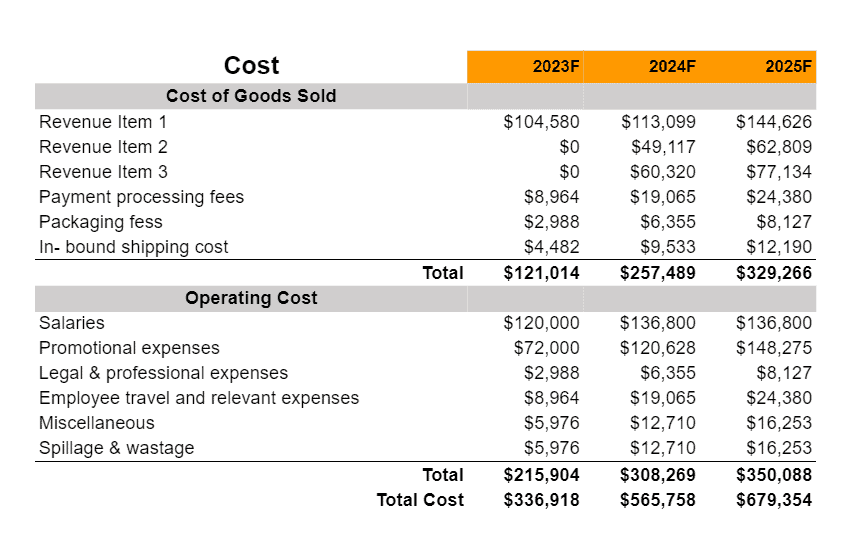
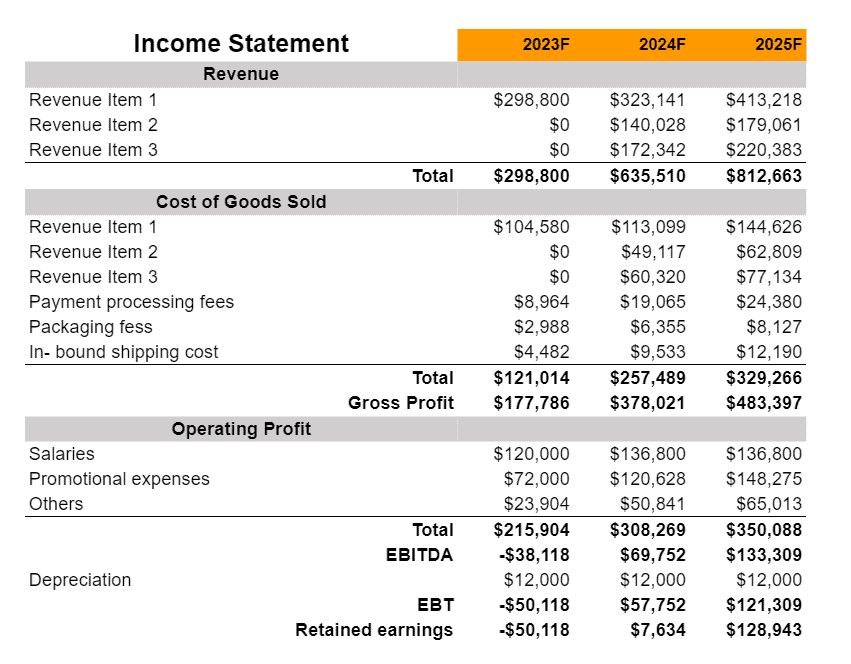
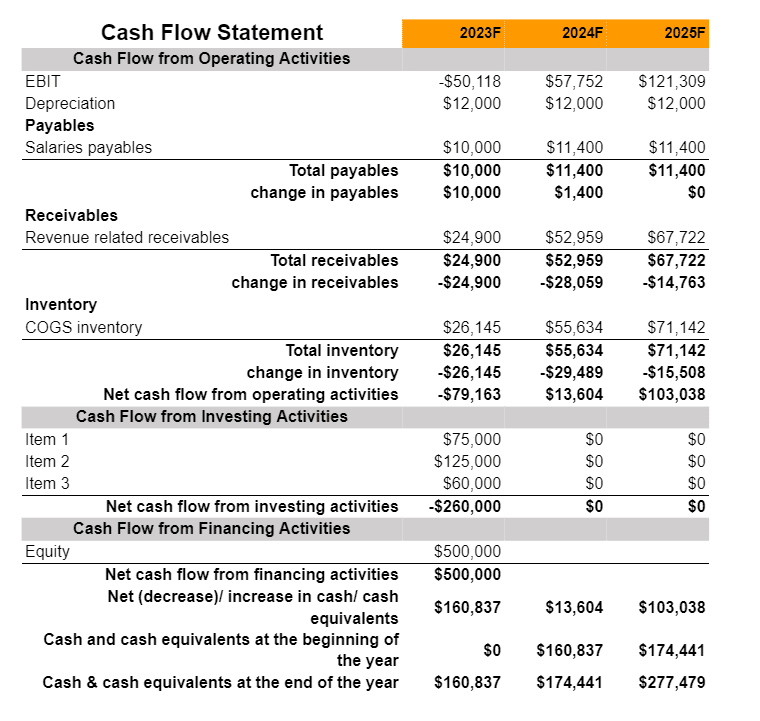
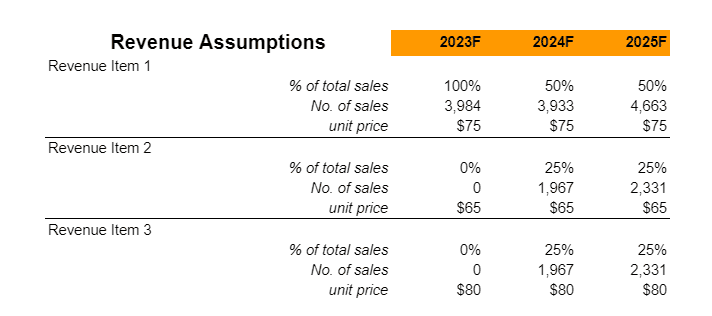
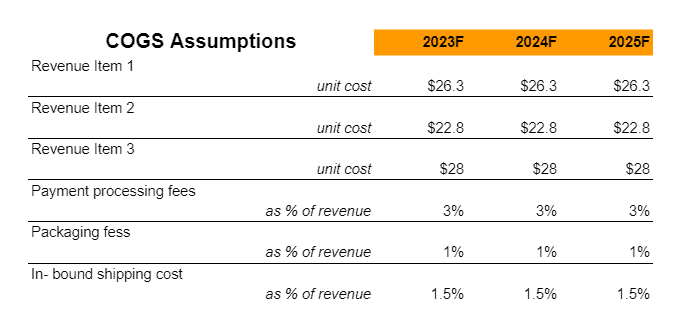
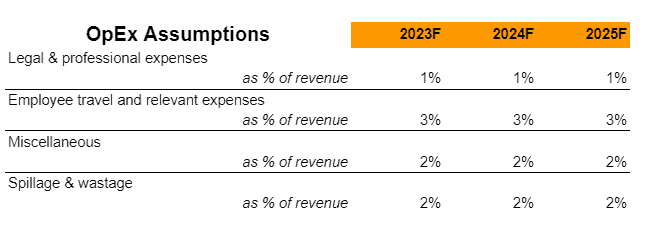
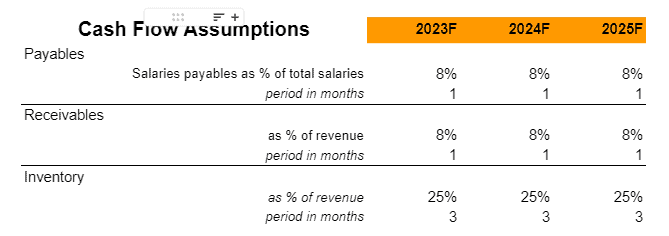
A financial plan of a Barber Studio business plan provides a comprehensive projection of a company’s financial health and its anticipated monetary performance over a specified period. This section encompasses a range of financial statements and projections such as profit and loss statements, balance sheets, cash flow statements and capital expenditure budgets. It outlines the business’s funding requirements, sources of finance and return on investment predictions. The financial plan gives stakeholders particularly potential investors and lenders a clear understanding of the company’s current financial position. A financial plan helps businesses demonstrate their financial prudence, sustainability, and growth potential.
Earnings
Liquidity
Related Business Plans:


