Written by Elma Steven | Updated on May, 2025

How to Write a Box Truck Business Plan?
Download the Free Box Truck Business Plan Sample in PDF. The business plan should includes a 5 year financial projection, marketing plan, industry analysis, organizational overview, operational overview and finally an executive summary. Remember to write your executive summary at the end as it is considered as a snapshot of the overall business plan. You need to be careful while writing the plan as you need to consider various factors that can impact the business’s success. Read the sample business plan in order to have a clear understanding on the process.
Table of Contents
Executive Summary
Urban Haul was founded by Mr. Adam Smith. The company specializes in a wide range of transportation services such as local delivery, long-distance freight transport, fast shipping and temperature-controlled logistics. Our unique selling proposition involves cutting-edge tracking technology, customized fleet choices and new ways to dynamically optimize routes.
Mission: Our mission at Urban Haul is to change the way logistics work by offering excellent, dependable and personalized transport services. We use our advanced tracking technology, customizable fleet solutions and dynamic route optimization to make sure that things are transported safely on time and efficiently.
Vision: Our vision is to be recognized as the leading supplier of logistics services and to expand and become an industry leader. We aim to go beyond the borders of Michigan leading the way toward a more ecologically conscious and efficient logistics industry.
Industry Overview:
The US Freight and Logistics Market will be worth USD 1.29 trillion in 2024 and will reach USD 1.57 trillion by 2029 (mordorintelligence). In 2023, the box trucks market was worth USD 12.60 billion. By 2030, it’s expected to be worth USD 17.73 billion. This is as a result of a 5% compound annual growth rate (CAGR) from 2024 to 2030 (verifiedmarketresearch).
More details on How to Write an Executive Summary.
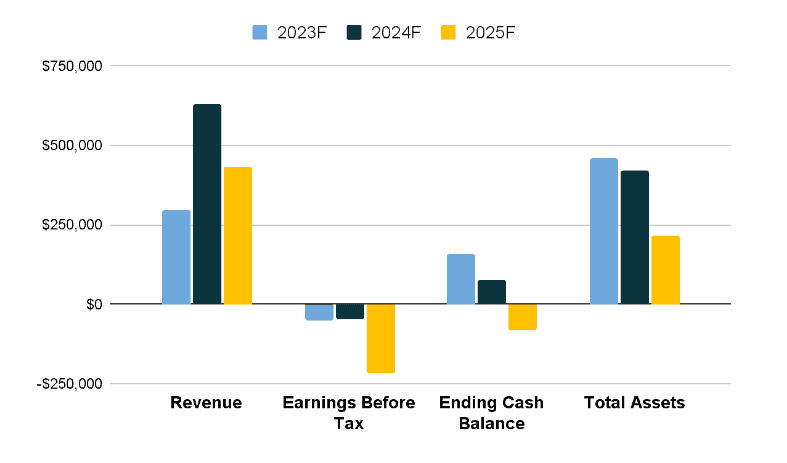
Financial Overview:
Business Description
Business Name: Urban Haul
Founder: Adam Smith
Management Team:
| Name | Designation |
| Adam Smith | Founder |
| Sophia Martinez | Fleet Manager |
| Benjamin Johnson | Driver |
Legal Structure: LLC
Location: Michigan
Goals:
✔️ To increase customer satisfaction by consistently delivering timely pickups & deliveries and by providing top-quality customer service.
✔️ To expand our fleet of vehicles to meet the growing demand for our services.
✔️ To reduce our environmental impact by increasing fuel efficiency and implementing eco-friendly practices.
✔️To diversify our services and offerings to better meet the needs of our clients.
Services & Pricing
- One Time Delivery Services: $5 to $10 per mile
- Contractual Delivery Services: $7 to $13 per mile
- Special Delivery Services: $12 to $15 per mile
Financial Overview
Fund Usage Plan

Key Metrics

Free Box Truck Business Plan Sample
Download Free Business Plan Sample
Write a plan in just 2 days!
Business Model Canvas
You can check out business model samples for more details.

SWOT
Here is a sample SWOT analysis:
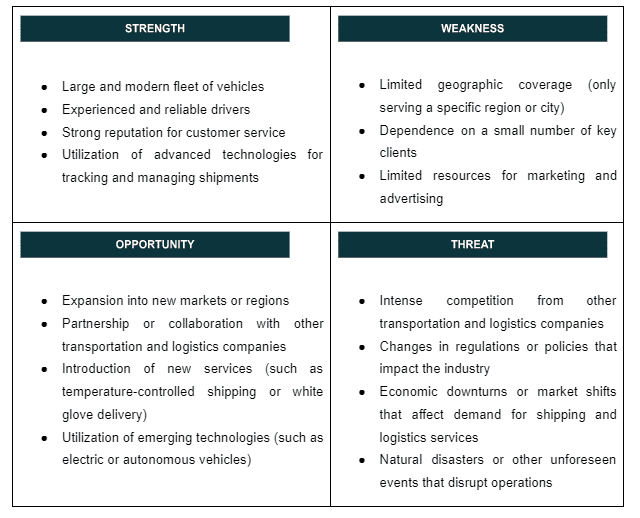
Check out the 100 SWOT samples which will give you a better idea on SWOT writing process.
Organizational Overview
Information related to your company’s structure and management team should be summarized in the Organizational Overview section of the plan. It’s especially important to include this section if you have a partnership or a multi-member limited liability corporation (LLC). You should explain about the functions of key roles in your business. In addition, explain how the founder along with top management team’s past experiences and credentials can create a successful venture.
Founder

Adam Smith
Adam Smith has a strong background in operations and a lot of experience in the delivery business. He brings a ton of knowledge as a founder at Urban Haul. He has handled supply chain for large companies and led successful transportation projects. Adam’s history of reducing operational inefficiencies, finding the best routes, and making sure supplies on time indicates his level of competence.
Adam’s attention to detail and unwavering commitment to customer happiness shows his willingness to do a great job. His past jobs has given him the strategic vision and leadership skills required to deal with problems and take advantage of chances in the competitive service sector. In addition, he has made Urban Haul a trusted partner for companies looking for reliable and efficient transport options by mixing his understanding of the industry with a focus on the customer.
Adam loves coming up with new ideas and wants to make a difference. He is always looking to integrate latest technologies, environmentally friendly ways of doing things and ways to make operations more efficient. Adam has shown that he can adapt to changing market conditions and put forward-thinking plans into action. This makes him a good choice to lead Urban Haul to continued growth and success.
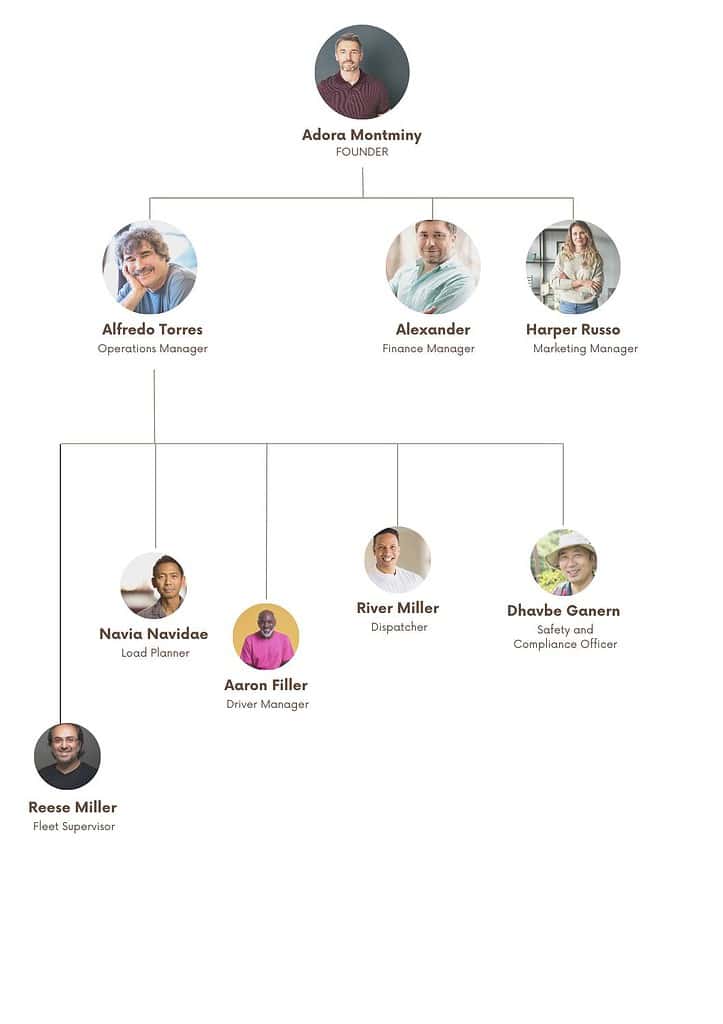
Organogram
Here is a sample organogram for you box truck business:
Industry Analysis
Industry Overview
The box trucking market size is values at around $12 billion in 2023 and is expected to increase to $17.4 billion by 2030. The demand from customers have skyrocketed in recent years for a number of reasons. Covered freight trucks of the light- to medium-duty kind are known as “box trucks.” Cube vans and cube trucks are common names for these vehicles. Since they are used in so many different industries for shipping and transport and they play a crucial role in logistics. The rising need for trustworthy and effective modes of transportation is one of the primary forces propelling the market. Alongside the rise of e-commerce and online shopping there has been a rise in the need for reliable last-mile delivery options.
As regulations become tougher and environmental concerns grow the need for fuel efficient vehicles has grown. Strict limits on emissions and incentives for greener transportation solutions have been established by a wide variety of governments and organizations. As a consequence, manufacturers have begun allocating resources toward developing electric and hybrid trucks which is creating fresh opportunities in the industry. Additionally, the market for Box Trucks has profited from the expansion of structured retail and distribution networks and urban infrastructure projects.
Target Market Segmentation
Geographic Segmentation
Customers and companies that need regular services should be able to get delivery services in cities like Detroit, Grand Rapids, and Lansing.
Deliver to the suburbs that surround big cities, where there is a need for both business-to-business and business-to-consumer supplies.
It is important to think about how to provide service in rural areas of Michigan, which may have different transport needs and less competition.
Psychographic Segmentation
Businesses that value time and efficiency while looking for reliable and on-time delivery services are called efficiency-seeking businesses.
Cost-conscious customers include both businesses and people who put a high value on service options that are cheap.
The Environmentally Conscious Segment is made up of customers who want shipping options that are good for the earth and might even invest in long-term methods.
Demographic Segmentation
Small to Medium-Sized Enterprises Local enterprises necessitating smaller, more frequent deliveries.
Prominent corporations receive larger contracts that require bulk and consistent deliveries.
Age Group: The relevance of targeting age-specific demographics may vary depending on the products being conveyed. For instance, aimed at younger consumers with technological devices, or established households with home appliances.
Behavioral Segmentation
Ratio of Usage: Distinguishing between consumers who require delivery services frequently (e.g., daily, weekly) and those who do so infrequently.
Maintaining a Loyalty Status by concentrating on establishing enduring connections with loyal consumers.
Specific Service Requirements: Certain customers may have a preference for expedited shipping, whereas others may place a higher value on cost rather than speed.
Market Size
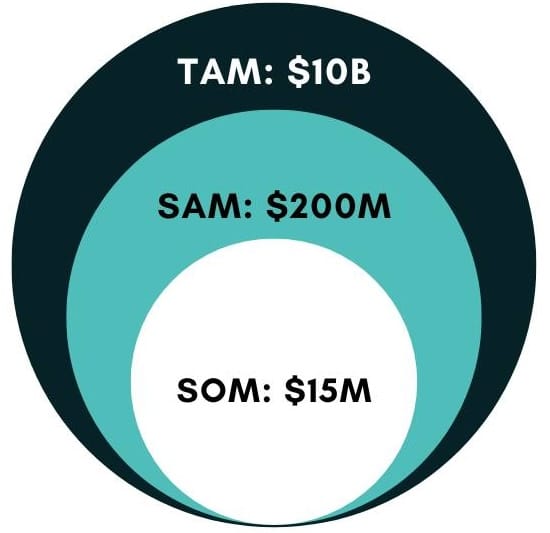
TAM – Total Addressable Market
Total demand for a product or service on the market is its definition. If a product or service were to attain a 100% market share, it represents the utmost potential revenue.
Regarding Your Company: Provide an estimation of the delivery and logistics services’ overall demand in Michigan or the region of interest. This refers to every prospective client who may require the services of a box vehicle, irrespective of their current utilization status.
SAM – Serviceable Available Market
The portion of the TAM that a company is able to effectively cater to. With your current business model and geographic reach, you can potentially access this segment of the market.
Regarding Your Company: Determine the segment of the TAM that can be realistically targeted by your box vehicle business. This may apply to particular geographic regions within Michigan, specific categories of products (such as non-perishable goods), or specific delivery types (such as B2B or B2C).
SOM – Serviceable Obtainable Market
The segment of the SAM that is capable of being captured. Taking competition and other constraints into account, this is the realistic market share that your company can anticipate attaining.
Regarding Your Company: Determine the practical share of the market that your SAM can attain in the short to medium term. Regarding pricing, service quality, competition, resources, and marketing strategy, this would vary.
How Your Box Truck Business Can Determine TAM, SAM, and SOM.
Competitive Landscape Analysis
Since Ctrone Xpress Transport has a lower overhead than its rivals in the sector, we have honed our strategies for setting competitive prices. We’ll use pricing as a competitive advantage to attract clients; our costs will be reasonable and non-negotiable. We will have several pricing ranges for various customer categories since our firm is accessible to people and organizations. As the company expands, we’ll keep reviewing our price structure to serve multiple customers.
Following are some of the major competitors:
Penske Truck Leasing Co., L.P.
A public firm with its corporate headquarters in Pennsylvania and around 64,000 workers is estimated to be Penske Truck Leasing Co., L.P. The firm is a market leader in at least one industry in the US: truck rental, where they generate an estimated 14.7% of total industry revenue. They are regarded as an All-Star because they outperform their competitors regarding market share, profitability, and revenue growth.
Ryder System, Inc.
Ryder System, Inc has a corporate headquarters in Florida and an estimated 42,800 workers. At least two sectors in the US where the corporation has a significant market share are supply chain management services and truck rental. Its highest market share is in the Supply Chain Management Services industry. They represent over 24.3% of total industry revenue. They are estimated as an All-Star because of their outperformer status in market share, profit, and revenue growth compared to their competitors.
Amerco
Amerco is a publicly traded business with its headquarters in Nevada and an estimated 29,800 workers. The firm is a market leader in at least one industry in the US: truck rental, where they generate an estimated 10.5% of total industry revenue. They are regarded as an All-Star since they outperform their competitors regarding market share, profitability, and revenue growth.
Marketing Plan
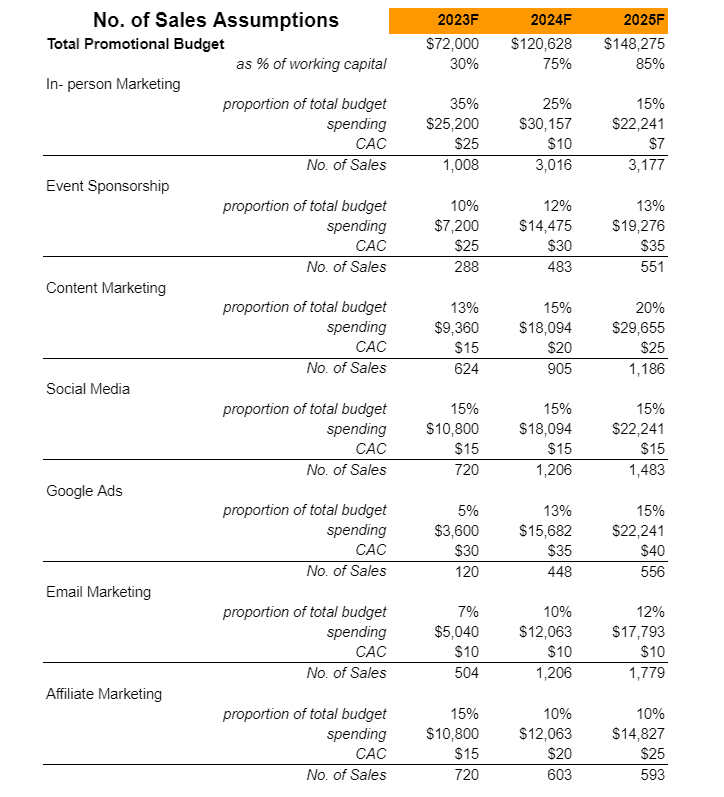
The marketing plan has five main sections. These sections are marketing budget, marketing channels, GTM or Go To Market Strategy and brand management. The marketing budget will explain how much you plan to spend on promotions and what will be the proportion of spending across the channels. The marketing channels section will talk about how you plan to use each of the promotional channels. The GTM strategy can be considered as the short term version of promotional channels section where you explain how you plan to penetrate the market using the channels at the beginning. Finally, brand management is the longer term version of the promotional channels section where you explain how you plan to enhance brand awareness, recognition and brand recalls amongst your target market.

Content Marketing: Create a blog on your website on what you has to offer to prospective customers.
Discounts: Provide multiple rewards or incentives to frequent customers, you’ll be more likely to attract them. Create a member referral scheme, for example, where members get a discount if they successfully recommend someone.
Social Media: Engage and promote on Twitter, publish news on Facebook, and utilize Instagram to promote curated photos of your business.
SEO (Search Engine Optimization) Local SEO makes it easier for local consumers to find out what you have to offer and creates trust with potential members seeking for what your business has to offer.
Email Marketing: send automated in-product and website communications to reach out to consumers at the right time. Remember that if your client or target views your email to be really important, they are more likely to forward it or share it with others, so be sure to include social media share.
Financials
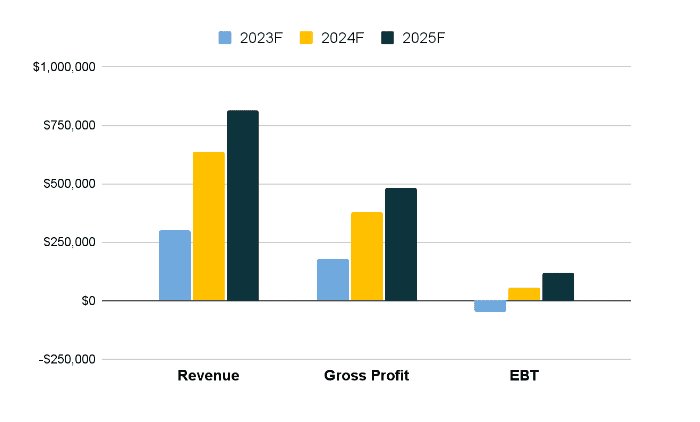
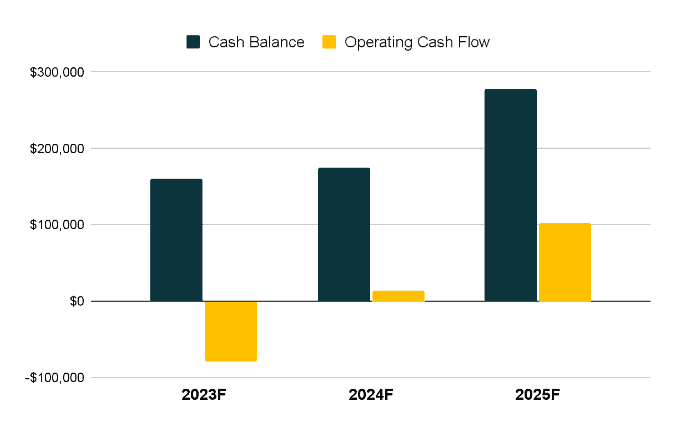
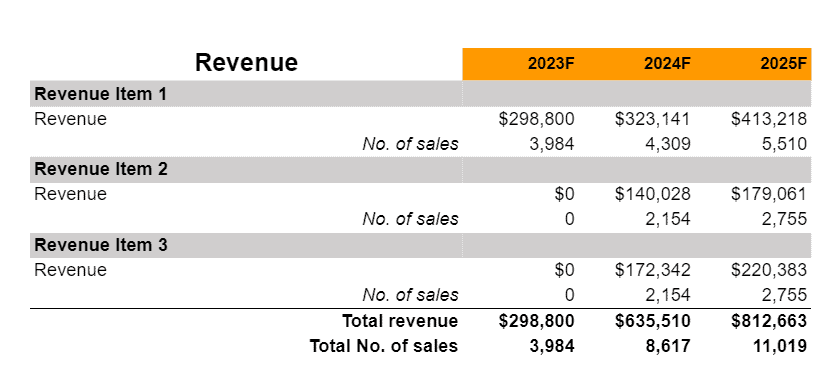
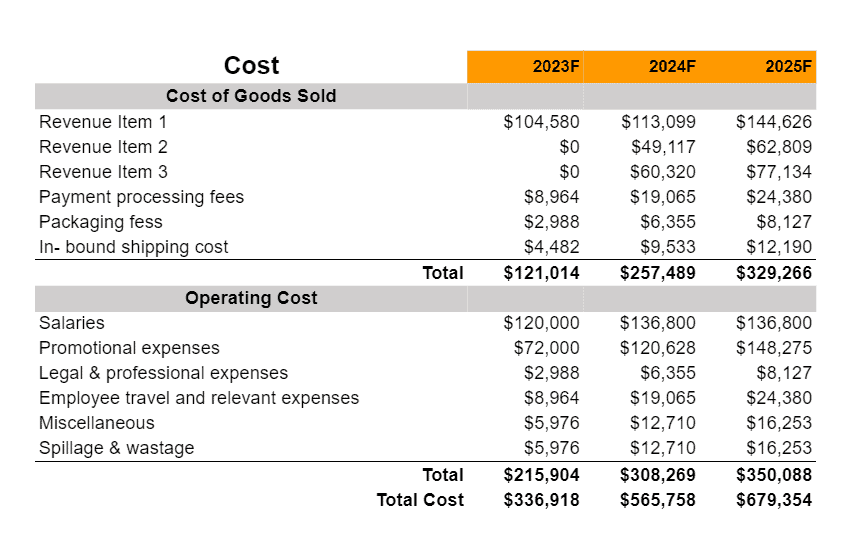
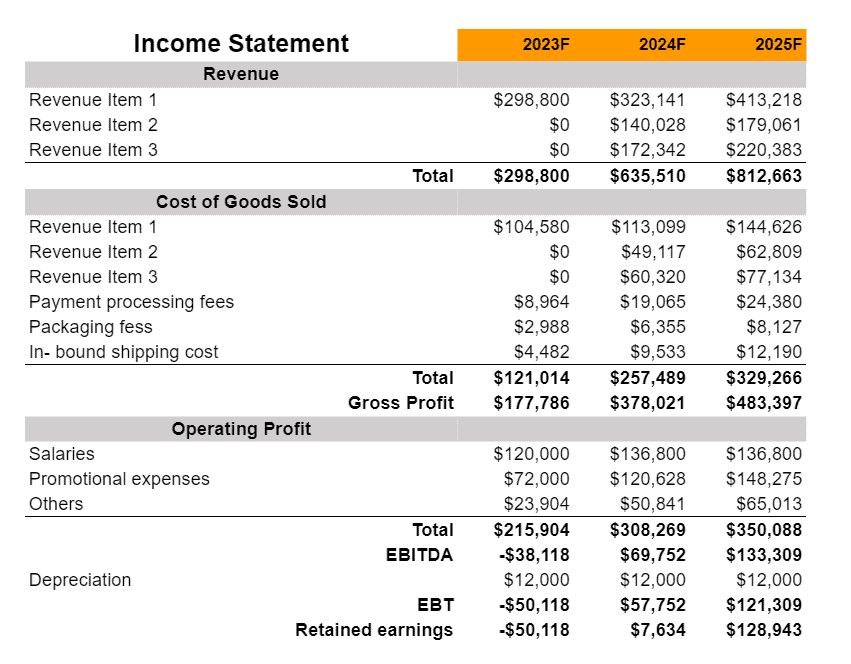
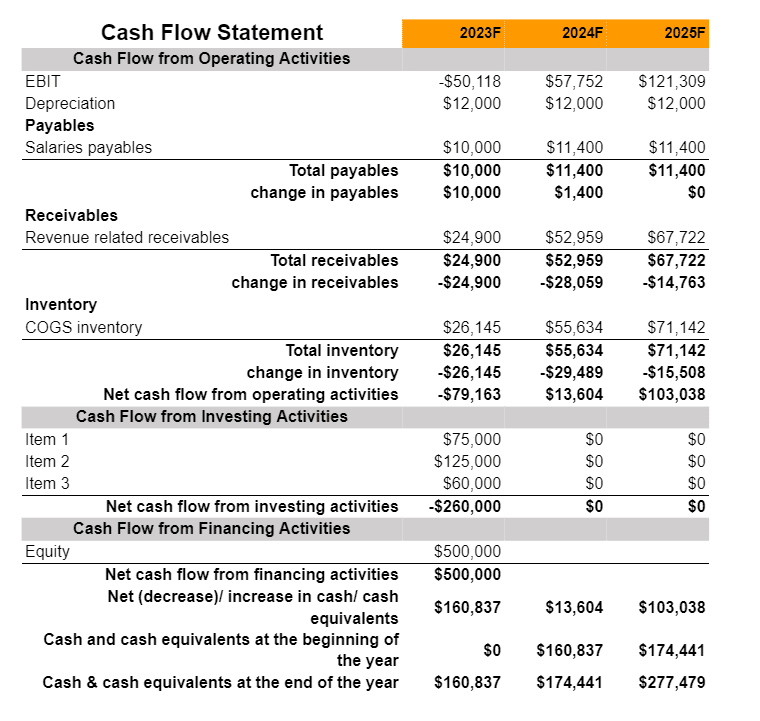
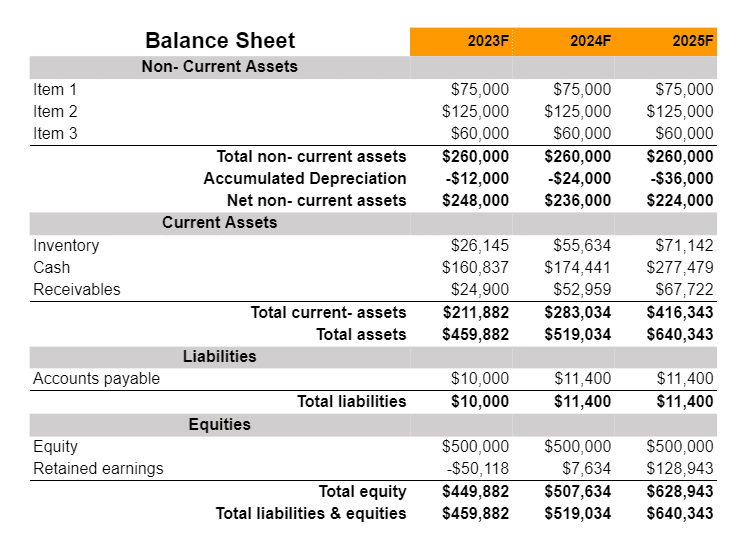
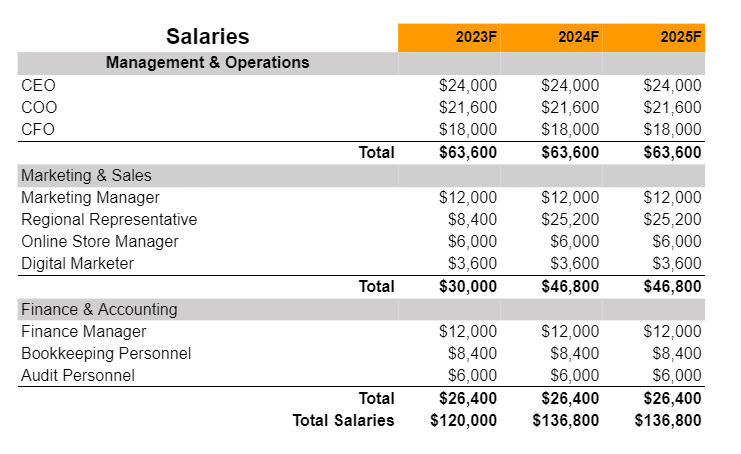
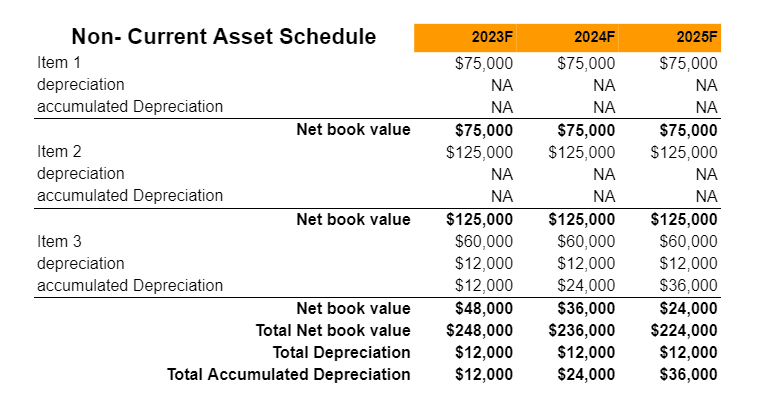
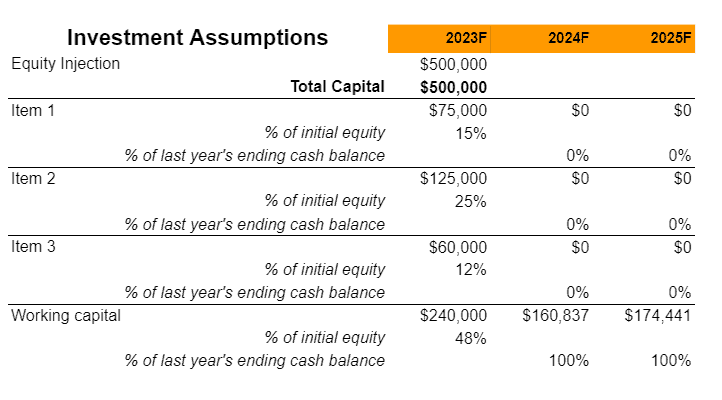
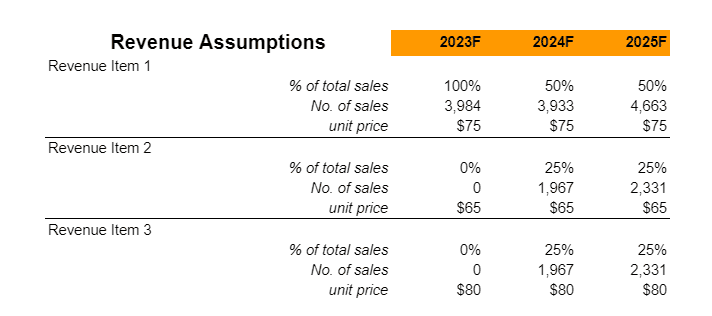
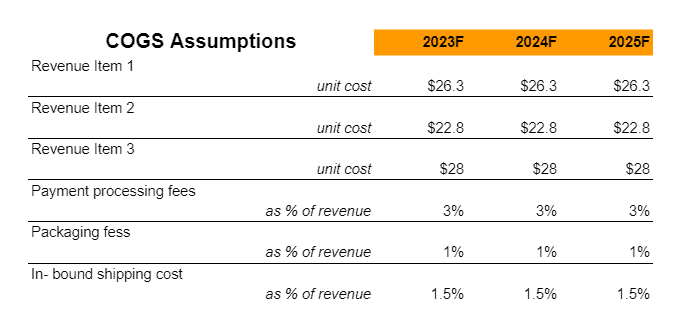
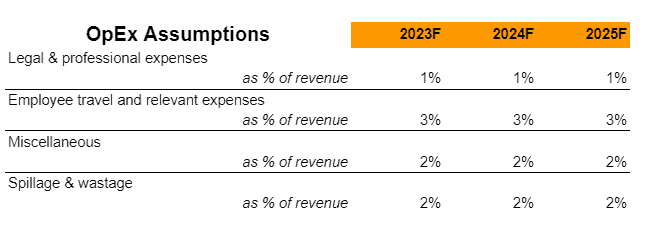
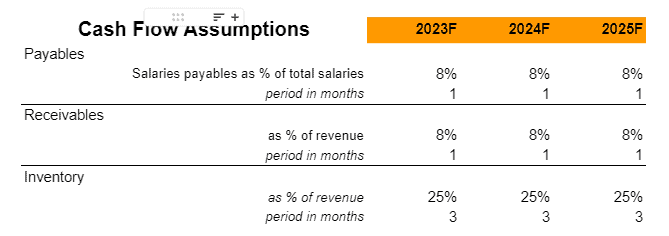
A financial plan provides a comprehensive projection of a company’s financial health and its anticipated monetary performance over a specified period. This section encompasses a range of financial statements and projections such as profit and loss statements, balance sheets, cash flow statements and capital expenditure budgets. It outlines the business’s funding requirements, sources of finance and return on investment predictions. The financial plan gives stakeholders particularly potential investors and lenders a clear understanding of the company’s current financial position. A financial plan helps businesses demonstrate their financial prudence, sustainability, and growth potential.
Earnings
Liquidity
Similar Articles on Business Plan:


