Written by Elma Steven | Updated on April, 2024

How to Write a Smoke Shop Business Plan?
Smoke Shop Business Plan is an outline of your overall smoke shop business. The business plan should include a 5 year financial projection, marketing plan, industry analysis, organizational overview, operational overview and finally an executive summary. Remember to write your executive summary at the end as it is considered as a snapshot of the overall business plan. You need to be careful while writing the plan as you need to consider various factors that can impact the business’s success.
Table of Contents
Executive Summary
Alexi Jonas’s is the founder of Mystique Smoke in Miami ushering in a new era in the smoking industry. Our establishment is situated in the core of this dynamic metropolis. It is a sanctuary for cigar aficionados providing an extensive inventory of premium cigars, vaporizer products of superior quality and a wide variety of smoking accessories. These products which serve as the foundation of our enterprise demonstrate our dedication to excellence and diversity. We also serve as a gathering spot for individuals of all skill levels and expertise in the smoking culture.
Mission: Our objective is to become the best tobacco shop in New Orleans within five years, and then expand to all 50 states. Puff Tobacco will have built a great brand identification and will begin franchising within 7 years of its creation.”
Vision: Puff Tobacco’s objective is to provide diversity under one roof, providing a one-stop-shop for fun-seekers looking for a place to relax while also enjoying their tobacco products, as well as a wine and alcohol bar. These services are only intended to make our customers feel unique, since we believe in our tagline, “The Customer is King!”
Industry Overview:
The smoke shop industry, valued at around $800 billion globally in 2023, is evolving with changing consumer habits and regulations. Traditional tobacco sales face challenges, leading U.S. shops to diversify into vaping products and CBD items. Vaping has become a significant sector, worth about $15 billion, as it’s perceived as a safer alternative. Additionally, the legal cannabis market, now valued at $20 billion, offers new opportunities for smoke shops. Despite facing regulatory and public health pressures, the industry adapts by embracing new products and trends. Check out this guide on how to write an executive summary? If you don’t have the time to write on then you can use this custom Executive Summary Writer to save Hrs. of your precious time.
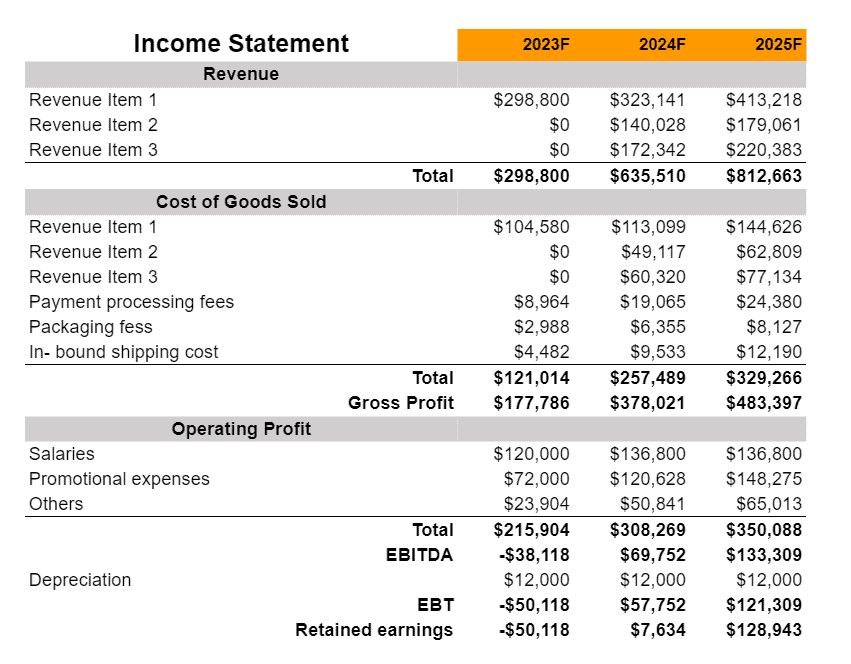
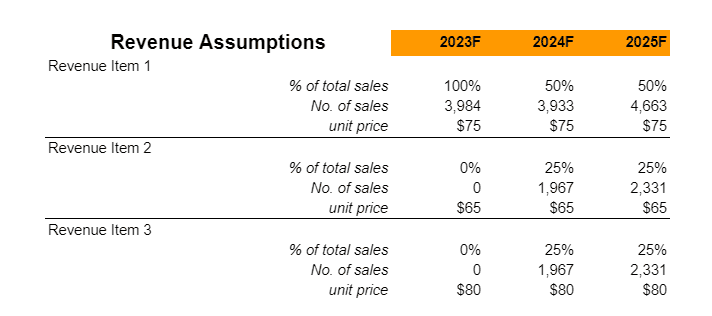
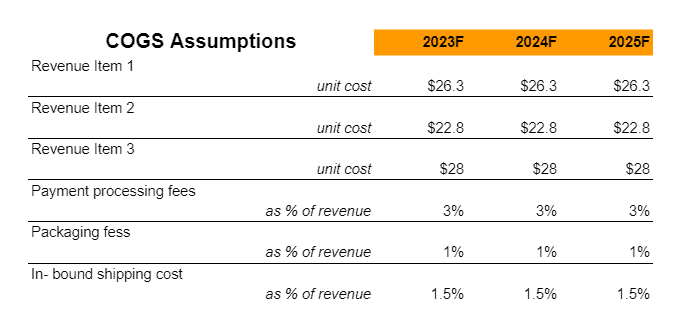
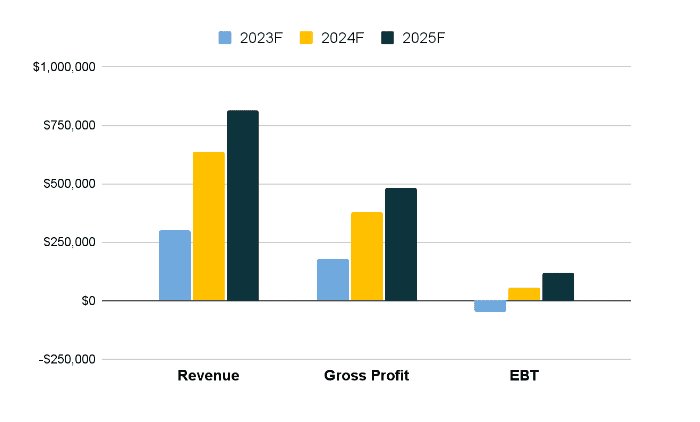
Financial Overview:

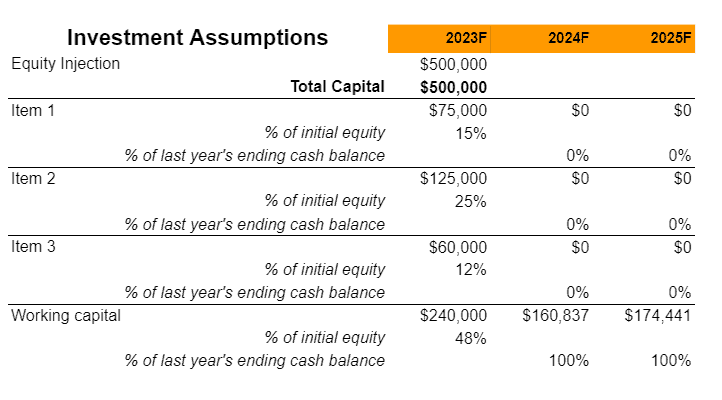
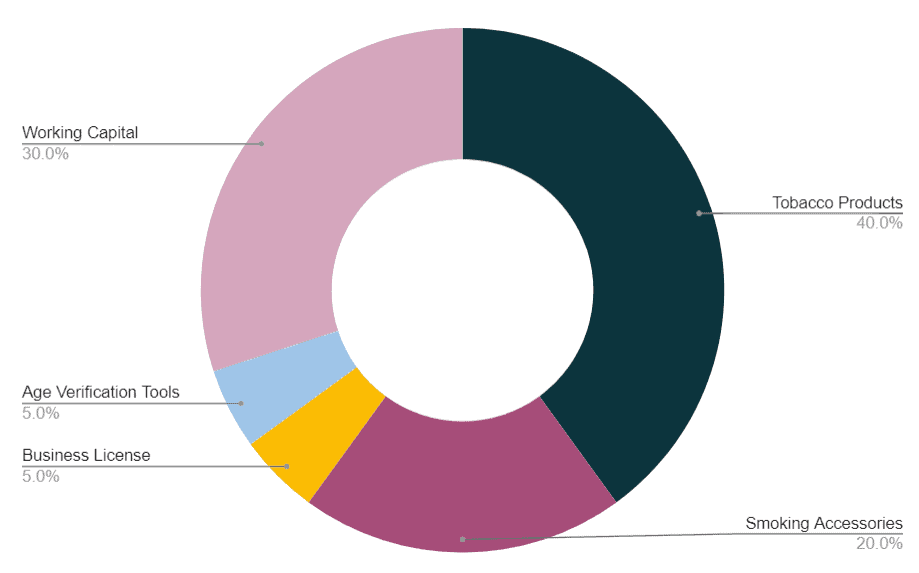
Fund Usage:
Business Model
Tips on Business Model Canvas
The Business Model Canvas is a high-level overview of the business model. It can also be considered as the business model map in the overall plan. The important partners, key activities, value proposition and cost & revenue sections are only some of the nine vital components. A company idea’s complexities may be mapped out, analyzed and communicated with the use of the canvas. It shows the whole picture of a company’s value creation, delivery and capture processes. It helps new business owners hone their ideas, encourage creative thinking and make sound strategic decisions. It’s a helpful resource for coming up with ideas, organizing plans and presenting business models to key players. Check out the 100 samples of business model canvas.

SWOT
Tips on SWOT Analysis
It offers a clear lens into a company’s strengths, weaknesses, opportunities and threats. This self-awareness enables effective resource allocation and strategic positioning against competitors. Businesses can mitigate risks, make informed decisions and set realistic goals. In addition, presenting a SWOT analysis in a business plan communicates to stakeholders that the company possesses a deep understanding of its market environment. In essence, SWOT ensures a business’s strategy is grounded in reality enhancing its chances of success. Check out the 100 SWOT Samples

Industry Analysis
Overview
The smoke shop industry, encompassing tobacco, vaping products, and various smoking accessories, has seen significant transformations in recent years. As of 2023, the global tobacco market, including cigarettes, cigars, and smokeless tobacco, is valued at around $800 billion. However, the industry faces regulatory challenges and changing consumer attitudes towards smoking.
In the U.S., smoke shops have increasingly diversified their offerings to include vaping products and cannabidiol (CBD) items, responding to a decline in traditional tobacco use and a rise in alternative smoking products. The vaping industry alone has grown substantially, with a market value of approximately $15 billion in 2023. This growth is attributed to technological advancements in vaping devices and a perception of vaping as a safer alternative to traditional smoking.
Moreover, the legalization of cannabis in various states has opened new opportunities for smoke shops. The legal cannabis market in the U.S. was valued at about $20 billion in 2023 and is projected to grow significantly. Smoke shops have adapted by stocking cannabis-related products like pipes, rolling papers, and vaporizers.
Despite challenges, the smoke shop industry’s adaptability to evolving consumer preferences and legal landscapes has allowed it to maintain a strong market presence. However, it remains sensitive to regulatory changes and public health campaigns against smoking.

Source: grandviewresearch
Products Insight
In 2020, cigarettes accounted for almost 75%. With millennials and working-class people increasingly partying and pub-hopping, global demand for flavored and plain cigarettes has risen. Another factor driving up cigarette consumption is the increasing number of young people in developing nations like India, Thailand, and China

Source: factmr
A CAGR of 2.8% is predicted for next-generation tobacco products between 2021 and 2028. Tobacco products with fewer hazardous effects are becoming more popular among smokers. Demand for next-generation tobacco products has increased. Demand for next-generation goods is expected to develop rapidly in North America, driven by growing consumer disposable income, more product launches, and increased access to high-quality items.
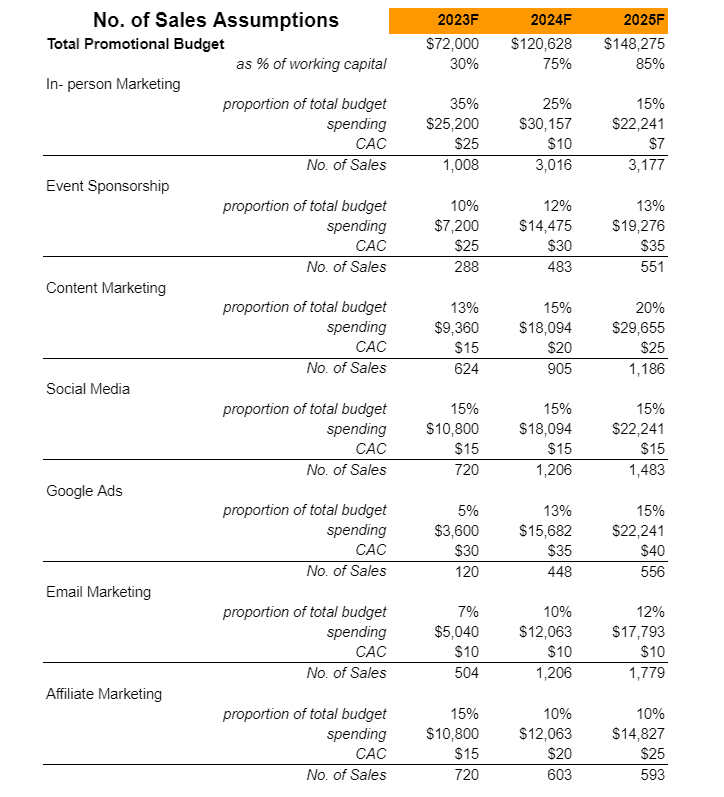
Marketing Plan

Website and Social Media: To market our brand, we use the internet and social media platforms like Instagram, Facebook, Twitter, YouTube, Google+, and others. Include Universal Laundromat in phone books and directories in your neighborhood. Create a company website and be active on key social media sites.
Seminar and Programs: Sponsor sports events and tournaments in town that are meaningful to you.
Referral Marketing: Encourage individuals to utilize referral marketing (word-of-mouth), and engage in direct marketing
Advertisement: Advertise Puff Tobacco Inc. on local television and radio stations, as well as in local publications. Ensure that all of our employees are wearing our branded clothing and that all of our official cars and trucks are well-branded with our company emblem and other identifying information. Distribute our flyers and handbills at strategic locations. Advertise Puff Tobacco Inc. on local television, radio, and print stations.
Pre-Opening Events: To raise awareness, have a party to honor the Puff Tobacco Inc. launch.
Commute Advertising: By employing individuals to display signs alongside we will draw attention to Puff Tobacco Inc. Install our billboards in high-traffic areas,
Organizational Overview
Founder

Johnathan Goodwin
Title: Founder and CEO
Johnathan Goodwin is a seasoned entrepreneur with over 10 years of experience in the retail management sector, particularly within niche markets that cater to lifestyle and smoking accessories. His journey in the retail industry began with his role as a customer service associate at a well-known health and wellness chain in Austin, Texas. Quickly rising through the ranks due to his acute business acumen and commitment to customer satisfaction, Johnathan eventually took on the role of store manager at a prestigious smoke shop in Denver, Colorado. There, he significantly increased store revenue by 40% within two years through strategic product diversification and by enhancing customer engagement strategies.
Armed with robust experience and an entrepreneurial spirit, Johnathan decided to create his vision for the ideal smoke shop. His concept, [Your Smoke Shop’s Name], is built on the foundation of offering a premium, curated selection of smoking paraphernalia, ranging from artisanal glass pieces to the latest in vaporizing technology. He is dedicated to providing a superior shopping experience that educates and delights both connoisseurs and new customers alike.
Johnathan holds a Bachelor’s degree in Business Administration from the University of Colorado Boulder, with a concentration in Entrepreneurial Studies. His educational background, combined with real-world experience, has equipped him with the necessary tools to navigate the complexities of the smoke shop market. His leadership at [Your Smoke Shop’s Name] is characterized by a hands-on approach, a commitment to community engagement, and a relentless pursuit of quality and innovation.
Organogram

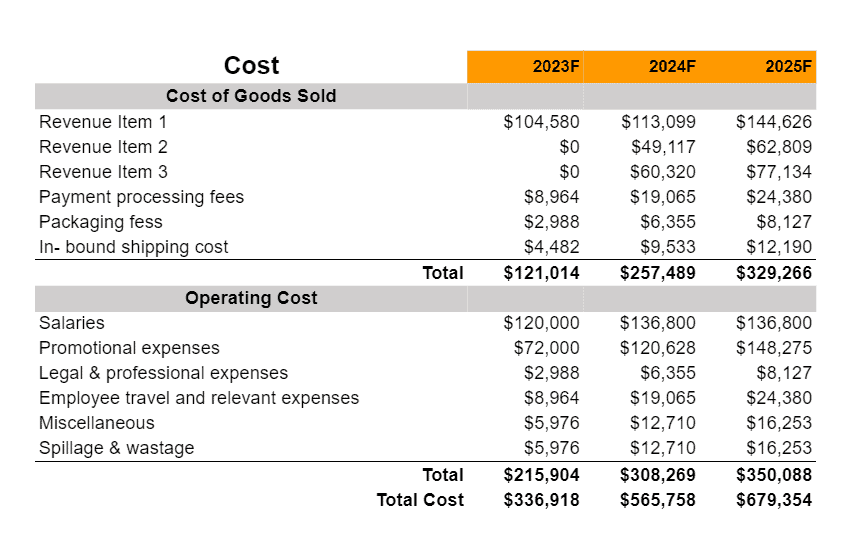
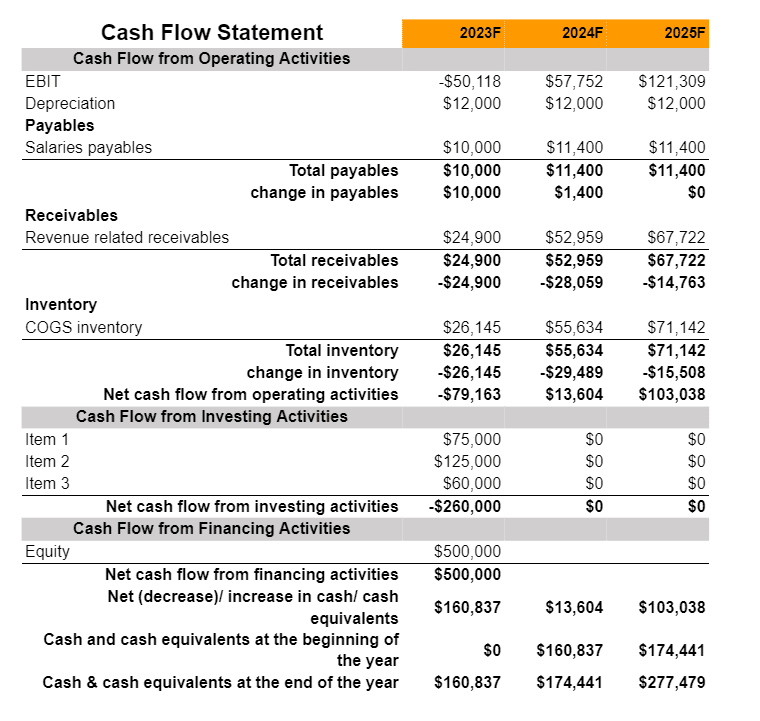
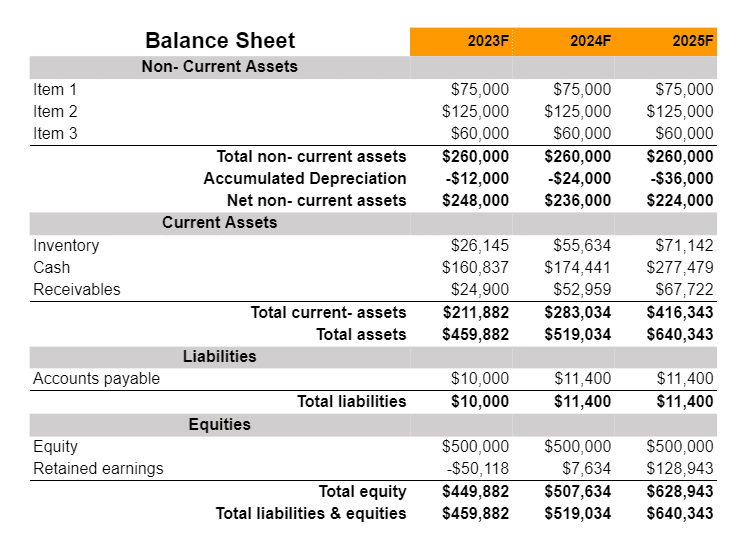
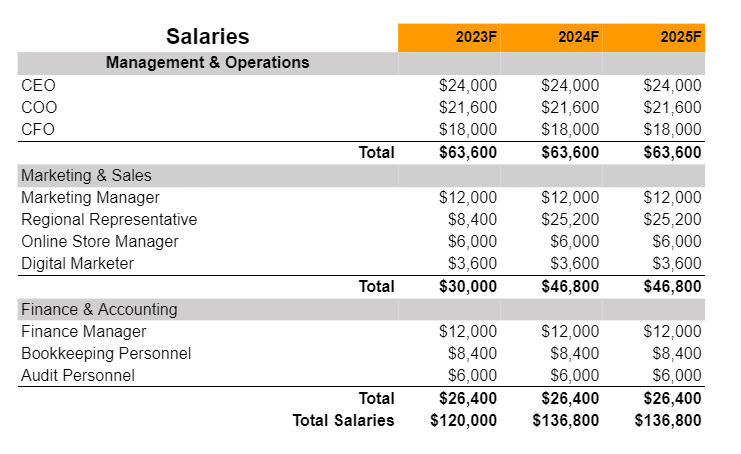
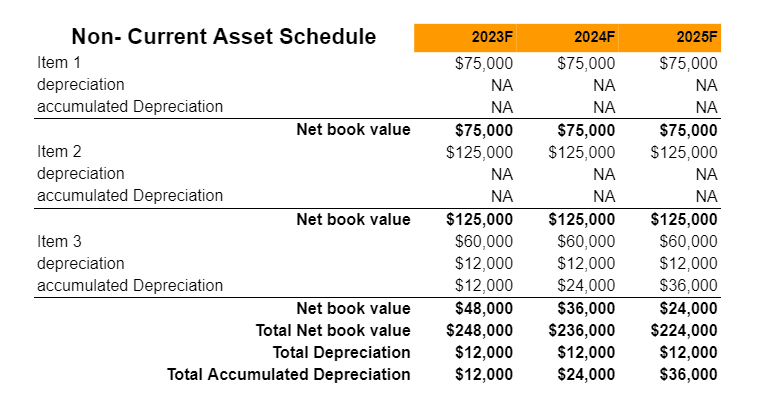
Financial Plan
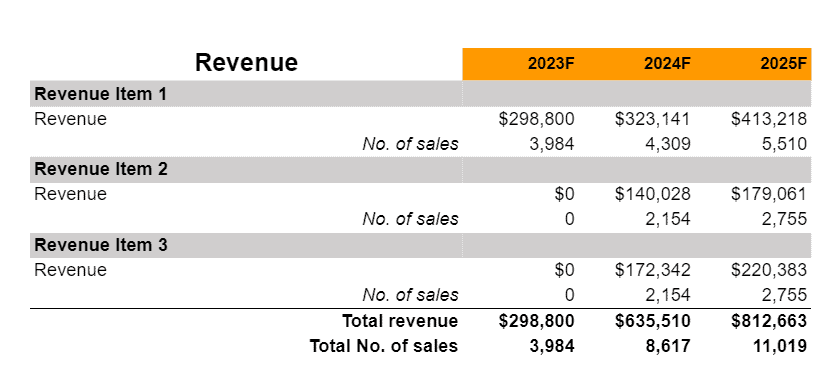
Earnings
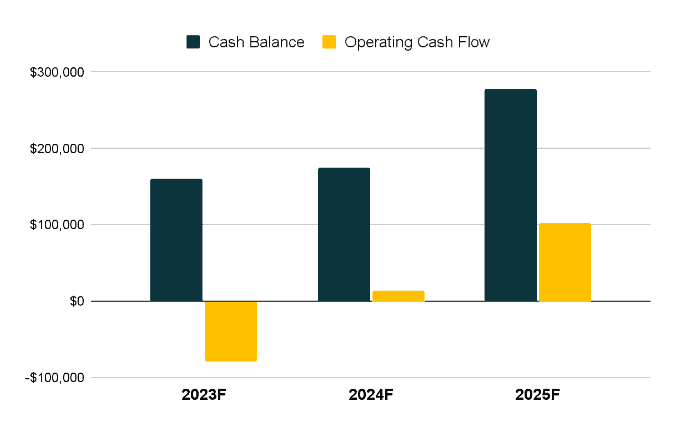
Liquidity
