Written by Elma Steven | Updated on July, 2024

Executive Summary
Overview
SqueakClean has done well in the United States and has become popular online, helping them grow quickly without spending too much. The CEO has launched over 12 national brands in the last 20 years in the industry. To expand our business in Asia and online, we are looking for financial support of $2.5 million as we want to avail our eco-friendly and organic liquid soap nationally.
Mission
SqueakClean makes natural, eco-friendly liquid soap to clean and reduce our environmental impact. Giving back to our communities and supporting local initiatives is also part of our corporate responsibility.
Vision
SqueakClean seeks to be the world’s leading natural and eco-friendly liquid soap brand while upholding our corporate responsibility and sustainability goals.
Industry Overview
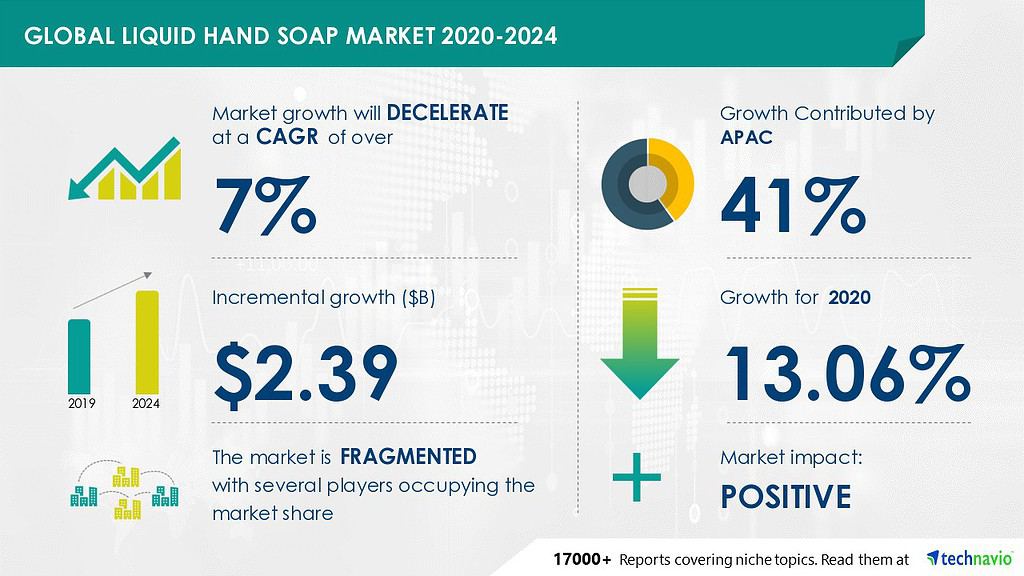
Demand for natural and eco-friendly products has driven liquid soap market growth in recent years. In 2020, the liquid soap market was worth $18.3 billion, with a projected 6.3% compound annual growth rate (CAGR )from 2021 to 2028. Liquid soap markets are largest in North America and Europe, with Asia-Pacific and Latin America expected to grow fastest which makes the industry highly competitive.
Financial Overview

Financial Highlights
| Liquidity | 2020A | 2021A | 2022F | 2023F | 2024F |
| Current ratio | 6 | 12 | 23 | 32 | 42 |
| Quick ratio | 6 | 11 | 22 | 31 | 40 |
| DSO | 8 | 8 | 8 | 8 | 8 |
| Solvency | | | | | |
| Interest coverage ratio | | | 8.2 | 11.1 | 14.2 |
| Debt to asset ratio | 0.01 | 0.01 | 0.2 | 0.18 | 0.16 |
| Profitability | | | | | |
| Gross profit margin | 51% | 51% | 53% | 53% | 53% |
| EBITDA margin | 12% | 14% | 21% | 22% | 22% |
| Return on asset | 5% | 6% | 13% | 14% | 14% |
| Return on equity | 5% | 6% | 16% | 17% | 17% |
Fund Usage

Industry Analysis
Overview
Liquid soap sales are expected to reach $24.8 billion by 2026, growing 5.5% annually from 2021 to 2026. Product quality, innovation, branding, distribution, and pricing are crucial to the industry’s success. Companies that can meet consumers’ growing demand for organic and natural products will succeed for the long-term. By 2025, online sales will also account for 13% of the market due to the rising success of e-commerce. However, the challenge here is the rising raw material prices and changing consumer preferences which can risk companies that don’t adapt to these changes.
Additional info
Touchless soap dispensers are a new liquid soap industry trend. Infrared sensors detect a user’s hand and dispense soap in response to the COVID-19 pandemic. Public restrooms and other areas are using this technology to reduce cross-contamination and promote hygiene. As consumers look to reduce germs and bacteria in their homes, touchless dispensers are becoming more popular. Some liquid soap companies are now developing touchless dispenser-specific products that may require different formulations or packaging.Touchless soap dispensers are a new liquid soap industry trend. Infrared sensors detect a user’s hand and dispense soap in response to the COVID-19 pandemic. Public restrooms and other areas are using this technology to reduce cross-contamination and promote hygiene. As consumers look to reduce germs and bacteria in their homes, touchless dispensers are becoming more popular. Some liquid soap companies are now developing touchless dispenser-specific products that may require different formulations or packaging.
Promotional Factors
Advertising, branding, and packaging promote the liquid soap industry. Packaging can draw consumers’ attention on store shelves, the more eye-catching it is, the better. Effective branding, such as a unique brand identity and consumer-resonant messaging, helps the brand stand out from the rest. Advertising through television, print, and social media is also crucial for brand awareness and sales. Giveaways and discounts can attract and retain customers. In such a competitive industry, successful companies need a strong and consistent promotional strategy to communicate their products’ unique value proposition to consumers.

Global Stats
In a report by ResearchAndMarkets, it estimates that the global liquid soap market will grow 5.5% from $18.2 billion in 2020 to $24.8 billion in 2026. Due to rising urbanization, disposable incomes, and hygiene awareness, the Asia-Pacific region is expected to grow the most. Liquid soap products are also popular in North America and Europe, where consumers highly value natural and organic products. The report also notes that the liquid soap industry is competitive, with Unilever, Procter & Gamble, Reckitt Benckiser, and Henkel as major players.On a report by ResearchAndMarkets, it estimates that the global liquid soap market will grow 5.5% from $18.2 billion in 2020 to $24.8 billion in 2026. Due to rising urbanization, disposable incomes, and hygiene awareness, the Asia-Pacific region is expected to grow the most. Liquid soap products are also popular in North America and Europe, where consumers highly value natural and organic products. The report also notes that the liquid soap industry is competitive, with Unilever, Procter & Gamble, Reckitt Benckiser, and Henkel as major players.
Additional Factors
Raw material prices, government regulations, supply chain disruptions, consumer preferences, and technological advances can affect the liquid soap industry. The recent COVID-19 pandemic has increased global demand for liquid soap and other hygiene products in order to fight against the virus. This has caused shortages of isopropyl alcohol and fragrances, which has affected the liquid soap production and its supply. To meet the demand and ensure product availability, many companies have adjusted their production and sourcing strategies. Some companies have also invested in sustainable sourcing and production in order to meet consumers’ demand for natural and eco-friendly products.

US Market
Grand View Research reported that the US liquid soap market will grow 5.8% from 2021 to 2028, reaching $2.2 billion in 2020. It is attributed to the rising consumer awareness of personal hygiene and the importance of handwashing, specifically due to the COVID-19 pandemic as well, a preference for liquid soap over bar soap, and the introduction of natural and eco-friendly products which helps the environment. Johnson & Johnson, Colgate-Palmolive, Unilever, and Procter & Gamble are currently dominating the US liquid soap market.
Marketing Plan

Website
A website is essential to any marketing plan because it is your brand’s online hub. It allows you to connect with customers and educate them about your business, products, and services. Websites build trust and credibility, which can boost sales. It also provides easy access to important information like contact details and product/service offerings and can be optimized for search engines to increase visibility and traffic. SqueakClean’s website is well-designed, and it contains useful information that could help us stand out from the competition.
Social Media
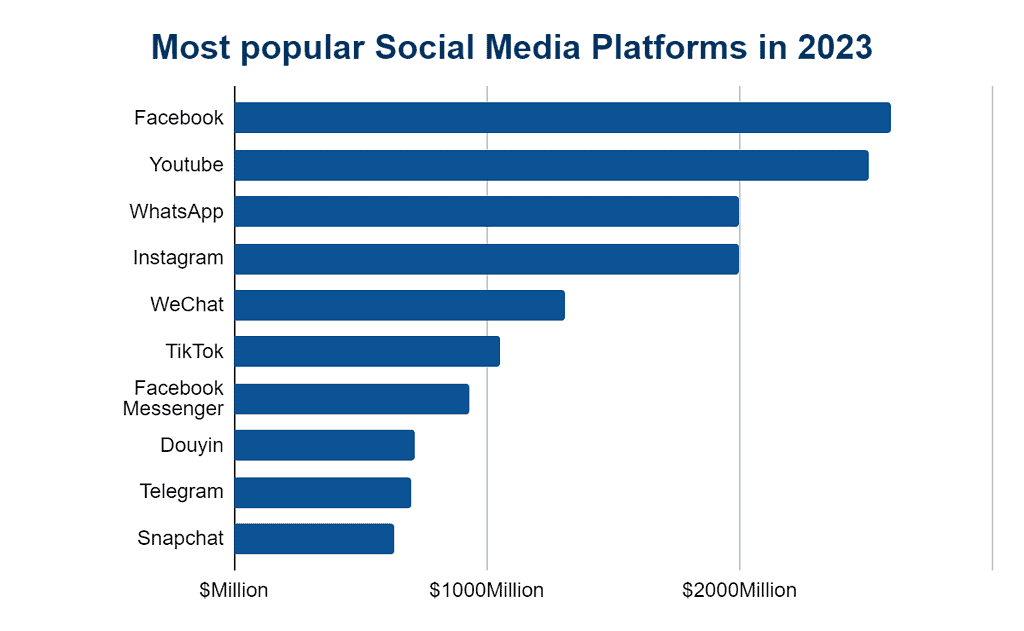
Social media helps you reach your target audience, build brand awareness, and promote your products or services online. Social media allows market research, customer feedback, and brand reputation monitoring. Social media can increase traffic, conversions, and business goals. Clear strategy and consistent messaging maximize social media impact. Here are some of the most popular social media platforms for 2023.

SqueakClean builds trust with a potential customer by actively responding to their questions on social media.
Brochures
Brochures promote your business, products, and services through printed materials about your company and its products. Brochures can introduce your company, highlight products and services, and demonstrate your USP. Trade shows, conferences, and in-store displays can distribute them. Brochures are cheap and easy to customize for specific audiences as well as give potential customers a tangible and convenient way to learn about your business and offerings. Flyers and Brochures are another medium to get the word out about SqueakClean and attract customers.
Signage
Signage can advertise your brand, promote specific products or services, and provide directions or information. Storefronts, trade shows, and events can use customized signage that matches your brand and target audience. They can boost brand recognition and make a visual impact. Outdoor, indoor, banner, and display signs are readily available for advertisement. Clear, eye-catching signage is another efficient means of advertising SqueakClean.
Free Samples
Free samples can boost sales by appealing customers to try your products and boost customer confidence in your product or service. In the long run, this can boost sales and customer loyalty. Trade shows, events, and direct mail campaigns are all good places to distribute free samples and can also be offered online or in-store to entice customers to buy.SqueakClean is available for free sampling. Because of this, you can rest assured that our product is of high quality.
Discounts
Discounts are used to entice customers to buy. Discounts can be percentage, flat rate, or bundled. They boost sales, loyalty, and new customers. Email, social, and advertising can promote discounts for you. To avoid eroding profit margins or creating an expectation of discounts, discounts should be used strategically. SqueakClean has a member referral program whereby regular customers can earn a discount voucher by referring new customers to the company.
Operational Overview
Market Research
First and foremost, you need to do market research in order to figure out who you’re selling your liquid soap to, what they like, and how they make purchases before you open for business. This will be useful in determining how to best design a line of liquid soap products to appeal to the intended consumers. Manufacturing processes that guarantee constant product quality and conform to applicable regulations must be established once the products have been designed.
To do so, we must first ascertain the machinery, supplies, and labor required to manufacture the liquid soap.First and foremost, you need to do market research in order to figure out who you’re selling your liquid soap to, what they like, and how they make purchases before you open for business. This will be useful in determining how to best design a line of liquid soap products to appeal to the intended consumers. Manufacturing processes that guarantee constant product quality and conform to applicable regulations must be established once the products have been designed. To do so, we must first ascertain the machinery, supplies, and labor required to manufacture the liquid soap.
Distribution
Establishing a distribution network that reaches the target market is a crucial part of any successful business plan. One method for doing so is to research potential distributors, retailers, and online marketplaces to see which ones have the highest potential for success. In addition, a profitable and competitive pricing strategy needs to be created.
Marketing and Sales
Even a business planning to sell liquid soap needs to have a marketing strategy that includes paid and unpaid forms of publicity and promotion.
Think about how you can best reach your demographic, build name recognition for your company, and increase sales by formulating a comprehensive sales strategy.

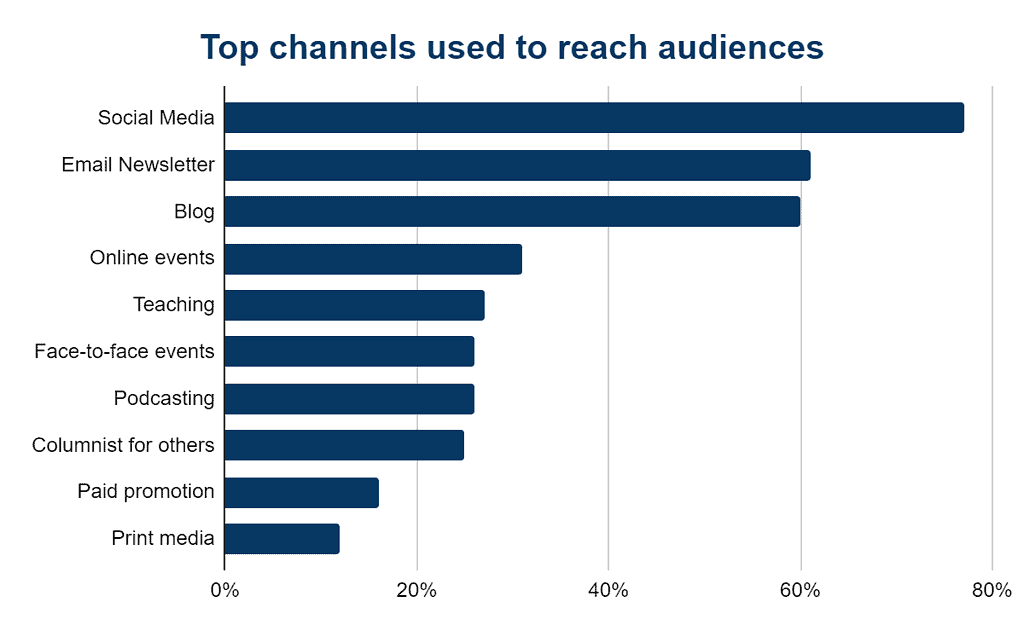
Consider the top channels used to reach audiences and use it to the company’s advantage to appeal to these people in trying out the product.
Financial Planning
Creating a sales forecast, income statement, cash flow statement, and balance sheet are all essential parts of financial planning. An integral part of any business plan is figuring out how much money will be needed to launch and expand the company, as well as listing potential funding sources like loans, grants, and investors. An example would be given of what financial planning would look like in a liquid soap business plan.
Organizational Overview
Organogram

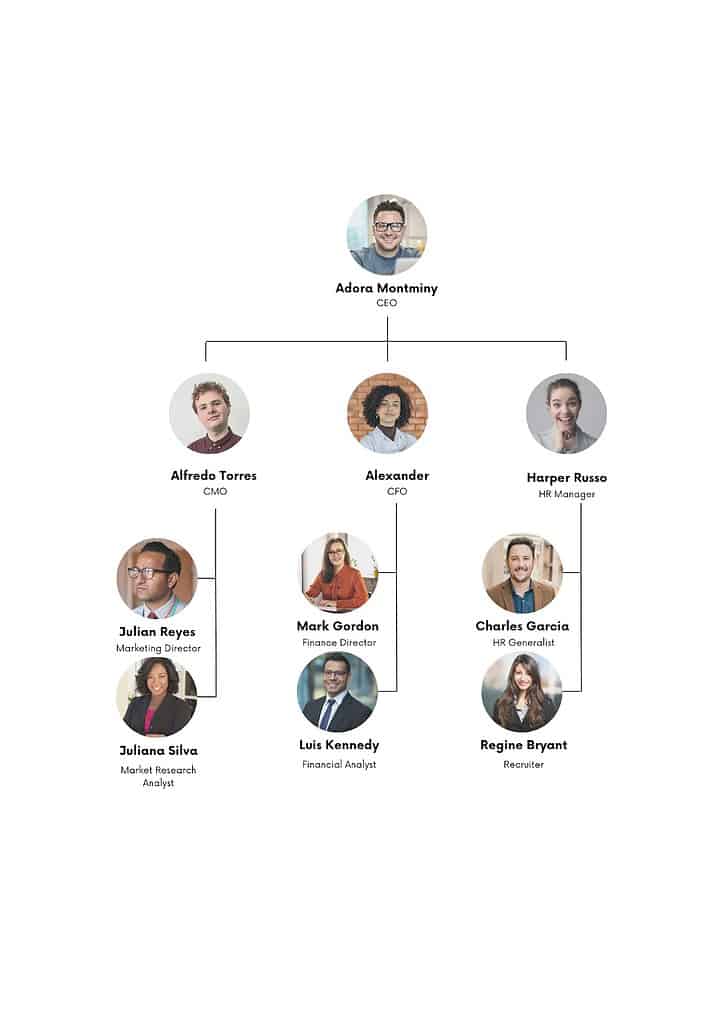
SqueakClean’s CEO, Adora Montminy, has been running the business for years, responsible for the overall strategy and management of the liquid soap business.. Adora’s family ran a small soap manufacturing business, and this inspired in him a lifelong passion for making luxurious all-natural soaps. Adora, armed with a business degree, launched a line of eco-friendly liquid soaps after realizing there was a market for such products. Adora worked tirelessly to build a loyal customer base and a respected brand name for her business, which led to rapid expansion and long-term success. Adora’s enthusiasm and dedication to his principles have been the driving forces behind the company’s expansion and success, and he never stops innovating to better serve his customers’ needs.
SqueakClean employs a full complement of executives reporting directly to the CEO, including a Chief Marketing Officer, Chief Financial Officer, and Human Resources Manager. The Chief Marketing Officer (CMO) oversees all promotional efforts and works to increase consumer recognition of the company’s brand with the help of the Marketing Director and the Market Research Analyst. The CFO employs a Finance Director and a Financial Analyst to keep the books in order and make sure the company is making progress toward its financial objectives. Finally, the HR Manager oversees the company’s human resource activities, including hiring and evaluating employees. She would have the support of the HR Generalist and Recruiter.
Financial Plan
Earnings

Break-Even Analysis

Income Statement
| 2020A | 2021A | 2022F | 2023F | 2024F | |
| ANNUAL REVENUE | |||||
| Item 1 | 9,217 | 59,117 | 175,410 | 415,277 | 781,357 |
| Item 2 | 34,701 | 222,558 | 660,368 | 1,563,394 | 2,941,580 |
| Item 3 | 4,067 | 19,561 | 46,432 | 78,519 | 114,905 |
| Total annual revenue | 47,985 | 301,236 | 882,211 | 2,057,189 | 3,837,842 |
| % increase | 528% | 193% | 133% | 87% | |
| COST of REVENUE | |||||
| Item 1 | 360 | 2,259 | 6,617 | 15,429 | 28,784 |
| Item 2 | 480 | 3,012 | 8,822 | 20,572 | 38,378 |
| Item 3 | 52,000 | 65,000 | 78,000 | 91,000 | 104,000 |
| Item 4 | 720 | 3,615 | 8,822 | 16,458 | 23,027 |
| Item 5 | 140,000 | 336,000 | 560,000 | 840,000 | 1,120,000 |
| Item 6 | 60,000 | 144,000 | 240,000 | 360,000 | 480,000 |
| Item 7 | 32,000 | 61,333 | 85,533 | 112,153 | 141,435 |
| Total Cost of Revenue | 285,560 | 615,220 | 987,794 | 1,455,612 | 1,935,625 |
| as % of revenue | 595% | 204% | 112% | 71% | 50% |
| Gross Profit | -237,575 | -313,984 | -105,583 | 601,578 | 1,902,218 |
| SELLING & ADMIN EXPENSES | |||||
| Item 1 | 28,000 | 96,800 | 154,880 | 175,692 | 193,261 |
| Item 2 | 75,000 | 105,000 | 120,000 | 120,000 | 120,000 |
| Item 3 | 36,000 | 96,000 | 108,000 | 120,000 | 120,000 |
| Item 4 | 8,000 | 12,000 | 12,000 | 12,000 | 12,000 |
| Item 5 | 3,839 | 18,074 | 44,111 | 61,716 | 115,135 |
| Item 6 | 3,359 | 12,049 | 26,466 | 41,144 | 76,757 |
| Item 7 | 5,600 | 10,000 | 12,904 | 15,034 | 17,376 |
| Item 8 | 6,667 | 14,000 | 22,067 | 30,940 | 40,701 |
| Total selling & admin expenses | 166,464 | 363,924 | 500,428 | 576,525 | 695,230 |
| as % of revenue | 347% | 121% | 57% | 28% | 18% |
| Net profit | -404,039 | -677,907 | -606,011 | 25,052 | 1,206,987 |
| Accumulated net profit | -404,039 | -1,081,947 | -1,687,957 | -1,662,905 | -455,918 |
Cash Flow Statement:
| 2020A | 2021A | 2022F | 2023F | 2024F | |
| CASH FLOW from OPERATING ACTIVITIES | |||||
| Net profit before tax | -$404,039 | -$677,907 | -$606,011 | $25,052 | $1,206,987 |
| Depreciation | $44,267 | $85,333 | $120,504 | $158,127 | $199,512 |
| Payables | |||||
| Item 1 | $4,333 | $5,417 | $6,500 | $7,583 | $8,667 |
| Item 2 | $11,667 | $28,000 | $46,667 | $70,000 | $93,333 |
| Item 3 | $6,250 | $8,750 | $10,000 | $10,000 | $10,000 |
| Item 4 | $3,000 | $8,000 | $9,000 | $10,000 | $10,000 |
| Item 5 | $667 | $1,000 | $1,000 | $1,000 | $1,000 |
| Total payables | $25,917 | $51,167 | $73,167 | $98,583 | $123,000 |
| change in payables | $25,917 | $25,250 | $22,000 | $25,417 | $24,417 |
| Receivables | |||||
| Item 1 | $320 | $1,506 | $3,676 | $5,143 | $9,595 |
| Item 2 | $360 | $1,807 | $4,411 | $8,229 | $11,514 |
| Total receivables | $680 | $3,314 | $8,087 | $13,372 | $21,108 |
| change in receivables | -$680 | -$2,634 | -$4,773 | -$5,285 | -$7,736 |
| Net cash flow from operating activities | -$334,536 | -$569,958 | -$468,280 | $203,311 | $1,423,180 |
| CASH FLOW from INVESTING ACTIVITIES | |||||
| Item 1 | $16,000 | $13,200 | $14,520 | $15,972 | $17,569 |
| Item 2 | $20,000 | $22,000 | $24,200 | $26,620 | $29,282 |
| Item 3 | $28,000 | $22,000 | $14,520 | $10,648 | $11,713 |
| Item 4 | $96,000 | $88,000 | $72,600 | $79,860 | $87,846 |
| Item 5 | $20,000 | $22,000 | $24,200 | $26,620 | $29,282 |
| Net cash flow/ (outflow) from investing activities | -$180,000 | -$167,200 | -$150,040 | -$159,720 | -$175,692 |
| CASH FLOW from FINANCING ACTIVITIES | |||||
| Equity | $400,000 | $440,000 | $484,000 | $532,400 | $585,640 |
| Net cash flow from financing activities | $400,000 | $440,000 | $484,000 | $532,400 | $585,640 |
| Net (decrease)/ increase in cash/ cash equivalents | -$114,536 | -$297,158 | -$134,320 | $575,991 | $1,833,128 |
| Cash and cash equivalents at the beginning of the year | – | -$114,536 | -$411,693 | -$546,014 | $29,978 |
| Cash & cash equivalents at the end of the year | -$114,536 | -$411,693 | -$546,014 | $29,978 | $1,863,105 |
Balance Sheet
| 2020A | 2021A | 2022F | 2023F | 2024F | |
| NON-CURRENT ASSETS | |||||
| Item 1 | $16,000 | $29,200 | $43,720 | $59,692 | $77,261 |
| Item 2 | $20,000 | $42,000 | $66,200 | $92,820 | $122,102 |
| Item 3 | $28,000 | $50,000 | $64,520 | $75,168 | $86,881 |
| Item 4 | $96,000 | $184,000 | $256,600 | $336,460 | $424,306 |
| Item 5 | $20,000 | $42,000 | $66,200 | $92,820 | $122,102 |
| Total | $180,000 | $347,200 | $497,240 | $656,960 | $832,652 |
| Accumulated depreciation | $44,267 | $129,600 | $250,104 | $408,231 | $607,743 |
| Net non-current assets | $135,733 | $217,600 | $247,136 | $248,729 | $224,909 |
| CURRENT ASSETS | |||||
| Cash | -$114,536 | -$411,693 | -$546,014 | $29,978 | $1,863,105 |
| Accounts receivables | $680 | $3,314 | $8,087 | $13,372 | $21,108 |
| Total current assets | -$113,856 | -$408,380 | -$537,927 | $43,349 | $1,884,214 |
| Total Assets | $21,878 | -$190,780 | -$290,791 | $292,078 | $2,109,122 |
| LIABILITIES | |||||
| Account payables | $25,917 | $51,167 | $73,167 | $98,583 | $123,000 |
| Total liabilities | $25,917 | $51,167 | $73,167 | $98,583 | $123,000 |
| EQUITIES | |||||
| Owner’s equity | $400,000 | $840,000 | $1,324,000 | $1,856,400 | $2,442,040 |
| Accumulated net profit | -$404,039 | -$1,081,947 | -$1,687,957 | -$1,662,905 | -$455,918 |
| Total equities | -$4,039 | -$241,947 | -$363,957 | $193,495 | $1,986,122 |
| Total liabilities & equities | $21,878 | -$190,780 | -$290,791 | $292,078 | $2,109,122 |
Related Articles:
